June is past the yearly peak when looking at overall tornadoes by month, but what it lacks in numbers compared to May it can make up in day-to-day consistency. With typically abundant moisture, and most of the United States “in play,” getting one or a handful of tornadoes in June is a pretty common event. On that level, the larger story is often the decrease in large-scale outbreaks, and the fact that by the end of the month summer can really take hold, either pushing activity north of the border, or keeping it from happening all together thanks to high pressure.
As seen in the June map of tornado strikes by county, the most fertile territory during the month of June resides from the central to northern Plains, also including the high Plains down into Texas. Much of the southeast, which sees its peak season earlier than the Plains, becomes significantly less frequented by tornadoes once in June. As with May, almost every part of the country is potentially at risk for a June tornado.
June Tornado Stats (1950-2011)
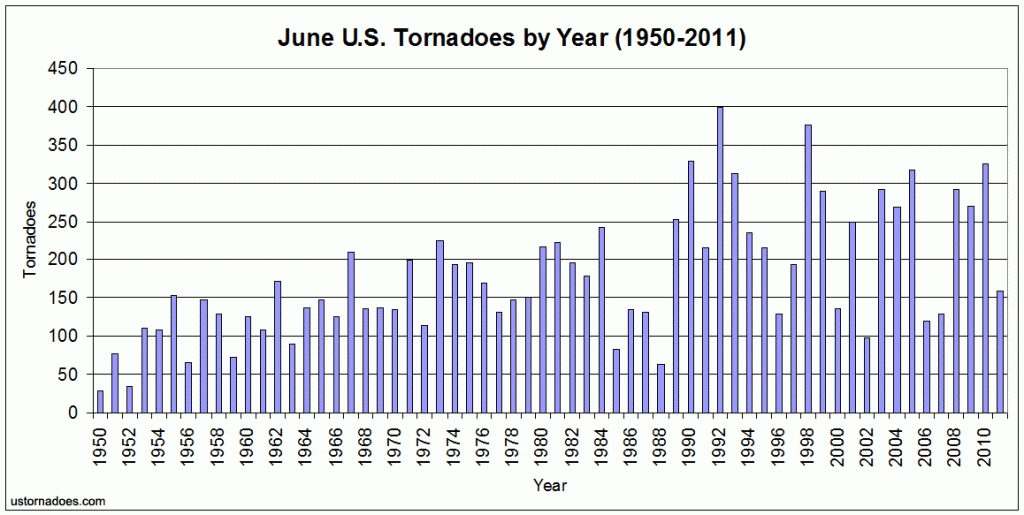
Total tornadoes: 11,033 (-1,316 from May)
Climatological average (1991-2010): 242.9 (-32.1 from May)
10-year average (2002-2011): 226.8
Long-term average (1950-2011): 178
Monthly high: 399 (1992)
Monthly low: 28 (1950) / 63 (1988), lowest recent
Total fatalities: 558
Total injuries: 9,471
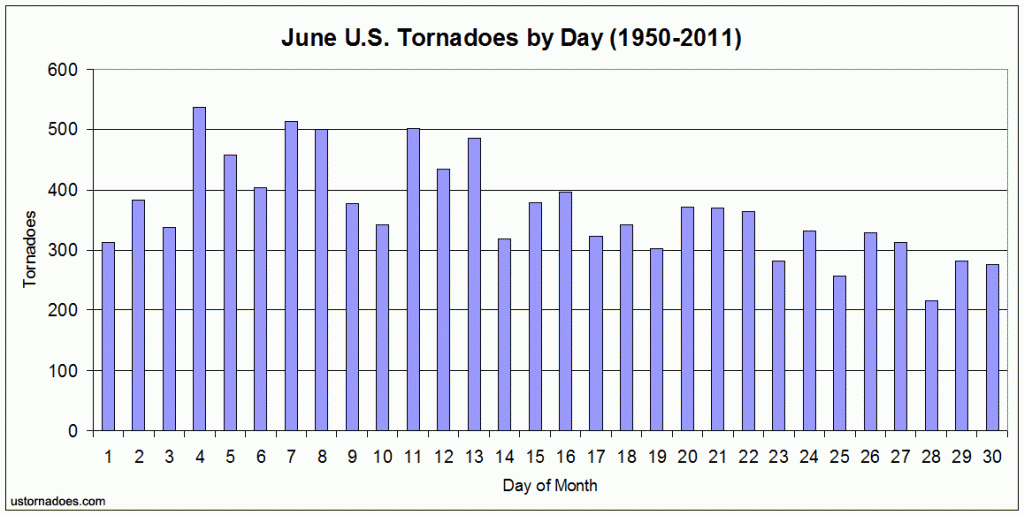
A decreasing trend in tallied tornadoes by day in June is apparent through the month, but it also consistently shows days with over 300 tornadoes through the period, nearly on par with May. And, when it comes to the “outbreak balancing” measure of tornado days, June falls squarely in the peak for the year. The first week of June features historical (1991-2010) odds of seeing a U.S. tornado touch down on any day of nearly 94 percent. By the final week, that percentage drops to around 86 percent. Just keep in mind, June tornadoes can be extra isolated and sometimes random.
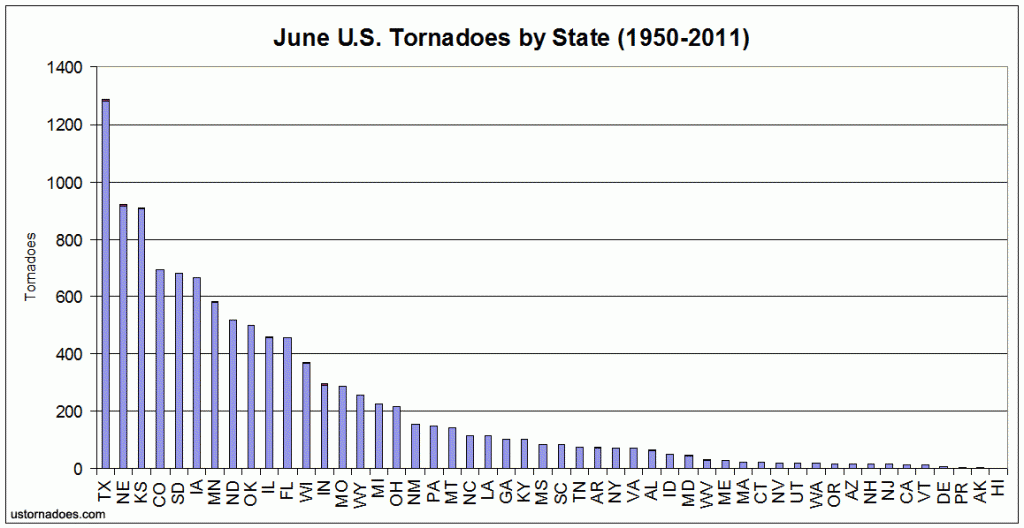
As noted above, the central to northern Plains as well as the high Plains running into Texas are the general hot spots of consistent June tornado activity throughout recorded history. In the top-5 list for states impacted by June tornadoes, Nebraska, Colorado and South Dakota see their peak of tornado climatology for the year. Oklahoma and Texas, which have very strong showings in earlier months, show significant drops in activity as the usual high pressure of summer sets in.
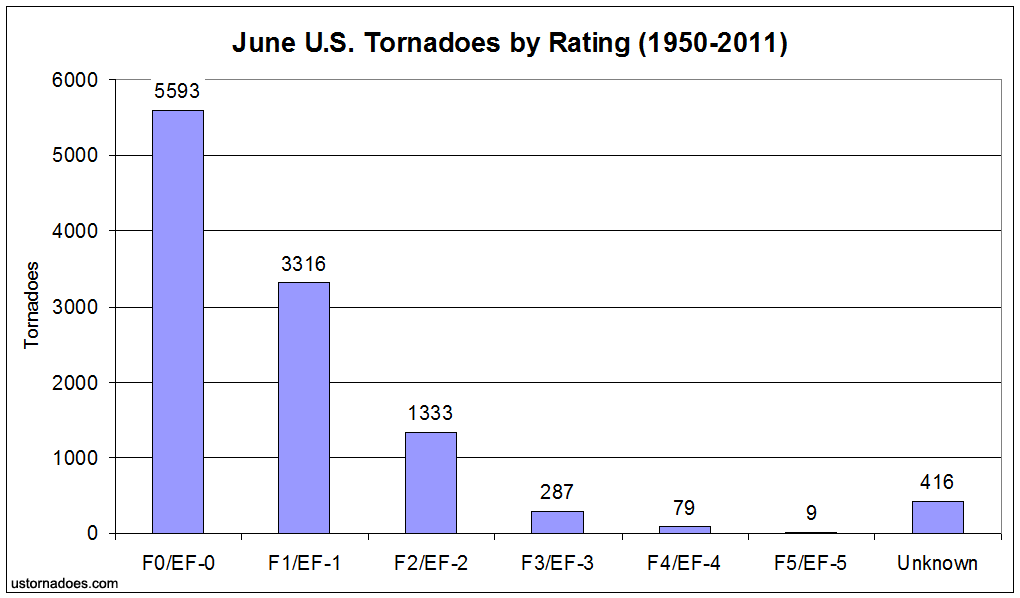
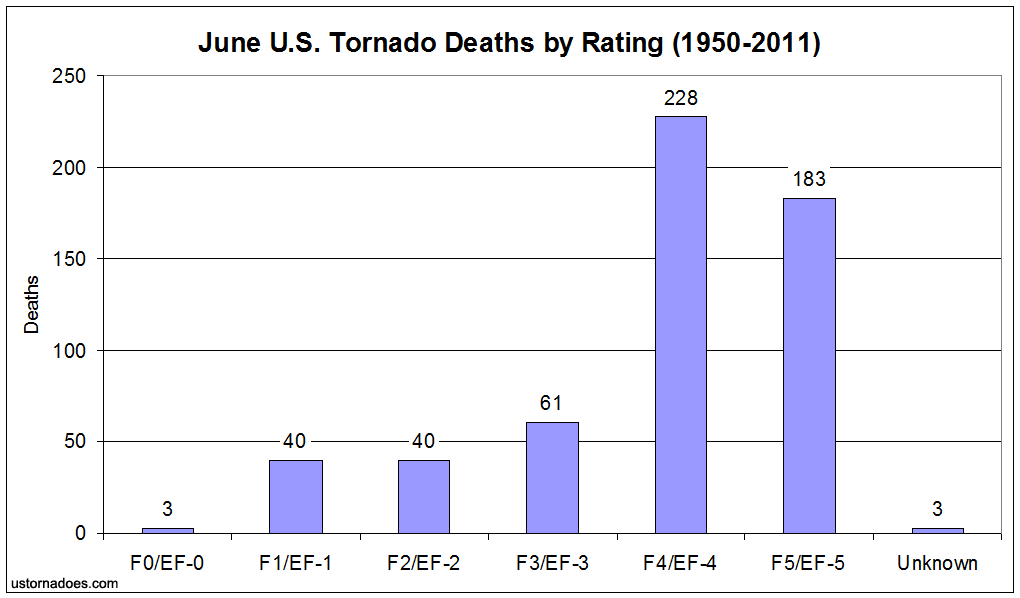
Significant (F2/EF-2+) tornadoes made up 15.5 percent of tornadoes from 1950-2011, and they were responsible for 91.8 percent of the deaths. The ratio of strong and violent tornadoes to all tornadoes continues a fall from peak in early spring during the month. An F5 tornado that struck Beecher (north end of Flint), Michigan on the 8th in 1953 is June’s deadliest since 1950, with 116 losing their lives.
SPC tornado data obtained at the Tornado History Project. Images can be selected for larger versions. Get updates about U.S. Tornadoes on Twitter and Facebook. Official 2012 data will be available during spring 2013.
Latest posts by Ian Livingston (see all)
- Top tornado videos of 2023 - January 1, 2024
- March 31, 2023 tornado outbreak videos - March 31, 2023
- Top tornado videos of 2022 - December 31, 2022
One thought on “U.S. Tornadoes: The Month of June by the Numbers”