It’s hard to forget the gut-wrenching moments of 27 April 2011 when a massive EF4 tornado tore across the city of Tuscaloosa, Alabama. By the time that tornado lifted just north of downtown Birmingham, it had covered 80.3 miles, reached up to about 1.5 miles wide, killed 64 people, injured over 1500, and caused about $2.2 billion in damage. But the 27 April 2011 tornado was not the only devastating blow that the Tuscaloosa area has suffered in recent years.
Today marks the twelfth anniversary of another devastating tornado in Tuscaloosa. Saturday, 16 December 2000 was a well-forecast, synoptically-evident severe weather day. A potent shortwave trough was located over the central United States and intensifying, with cyclogenesis occurring at the surface. In the low-levels a 65-knot low-level jet was advecting plentiful surface moisture and creating large, looping hodographs supportive of significant tornadoes. Below is a series of charts depicting the synoptic setup of the outbreak that produced the tornado.
Figure 1: 16/1200 UTC 300-hPa SPC analysis. Note the deep trough over the Plains.
Figure 2: 17/0000 UTC 300-hPa SPC analysis. Note the negative-tilt (NW-SE oriented) trough, indicative of a strengthening trough, as well as the high values of divergence, indicative of upward vertical motion/lift. The tornado occurred just after 1800 UTC, or right between the 1200 UTC and 0000 UTC analyses, with severe weather having shifted to Georgia and the Carolinas by this time.
Figure 3: 16/1200 UTC 500-hPa SPC analysis. Note the wind maximum over AR, MS, LA, and TX that would help support convection later that morning and through the afternoon. Also note the -15 to -16°C temperatures, supporting steep mid-level lapse rates and thus sufficient instability.
Figure 4: 17/0000 UTC 500-hPa SPC analysis. By this time, the trough has taken on a negative tilt, has formed a closed isoheight in the center, and the associated wind max has intensified, all indicative of the intensification of the trough.
Figure 5: 16/1200 UTC 700-hPa analysis. Note the low dewpoints over AR and LA, while the airmass at 700 hPa is more humid over MS and AL. The dry punch to the west of the outbreak area would advect in over the next several hours, promoting greater atmospheric destabilization.
Figure 6: 17/0000 UTC 700-hPa SPC analysis. As with the other levels, the low/trough intensify between 1200 UTC and 0000 UTC.
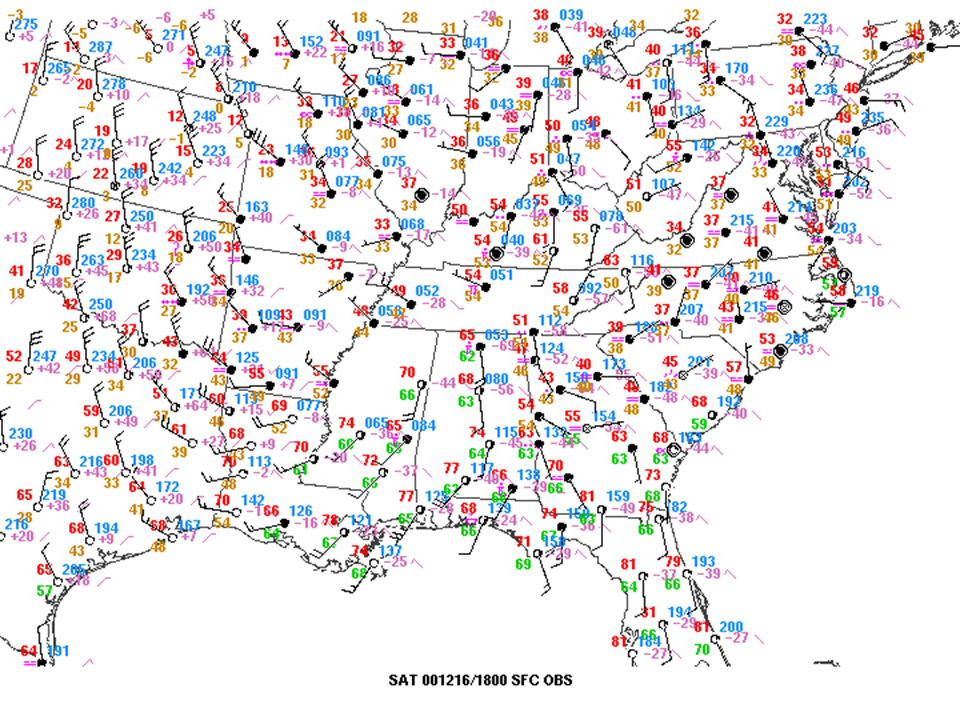
Figure 7: 16/1800 UTC surface observations. Note the very high dewpoints for December, with 63-66°F dewpoints prevalent ahead of the cold front across MS and AL.
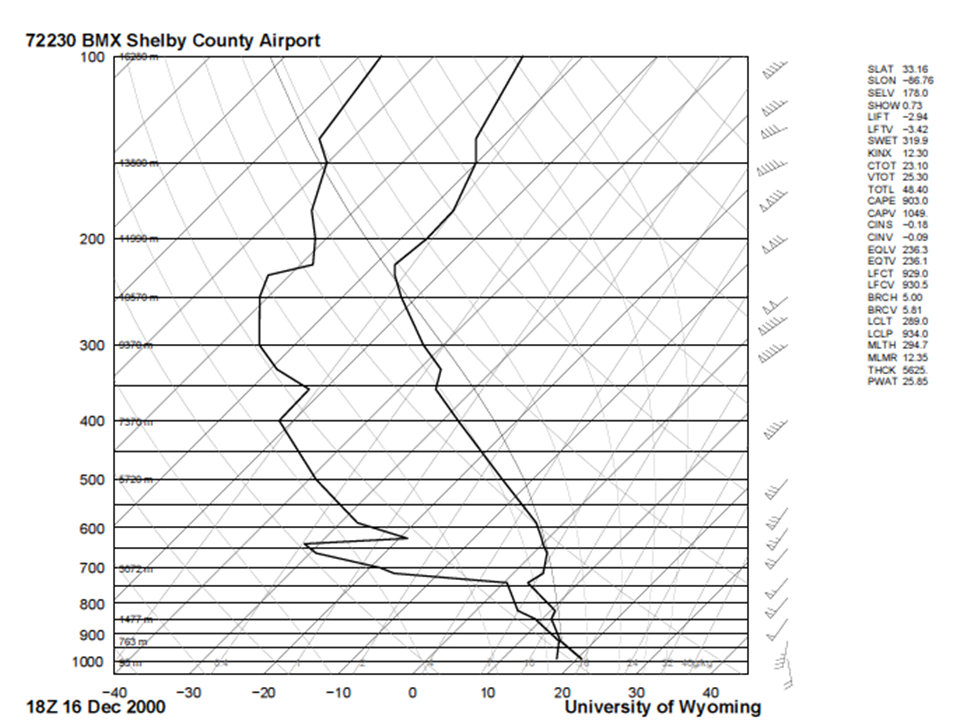
Figure 8: 16/1800 UTC KBMX skew-T/log-P plot. Even with an inversion at 750 hPa, CAPE on this sounding was up near 900 J/kg. This CAPE, in conjunction with the lift associated with the approaching trough, was more than sufficient to promote deep moist convection in the warm sector.
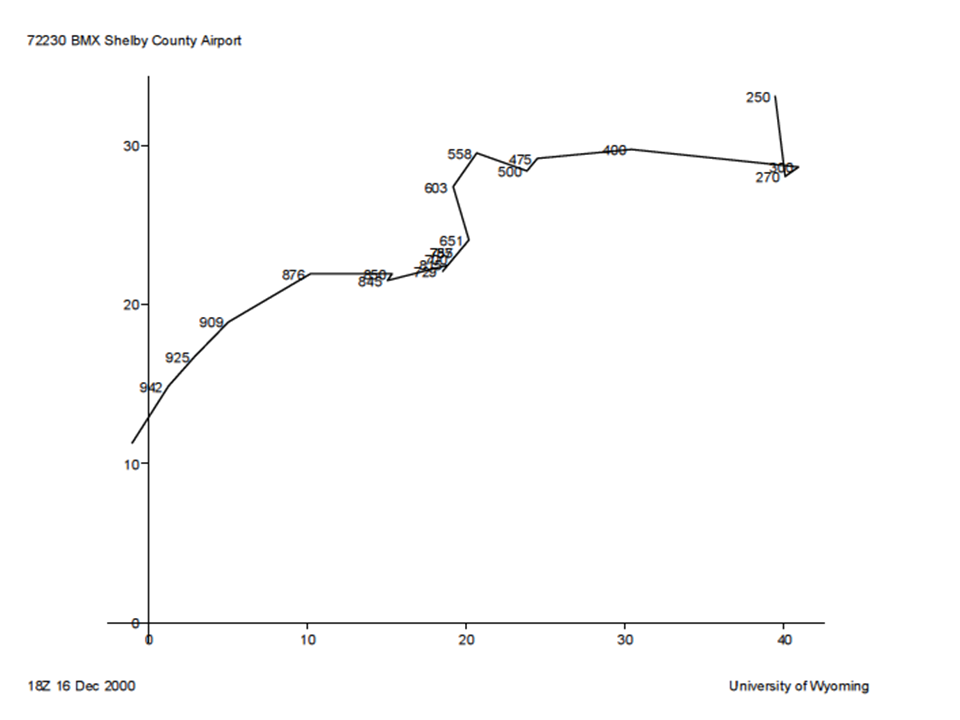
Figure 9: 16/1800 UTC KBMX hodograph. The large, looping signature is very suggestive of the potential for significant tornadoes.
The result of this synoptic setup was a significant severe weather outbreak by December standards. Two dozen tornadoes touched down across the Southeast, including several tornadoes of F2-F4 intensity.
Figure 10: SPC SeverePlot3.0 map of all tornadoes from 16 December 2000.
The incipient cell formed in Mississippi during the morning hours and had moved into western Alabama by midday. As the supercell moved into Tuscaloosa County, its mesocyclone rapidly intensified, producing a large, violent tornado. The tornado touched down at 1854 UTC, had a path length of 18 miles, and a maximum path width of 750 yards, just short of 1/2 mile.
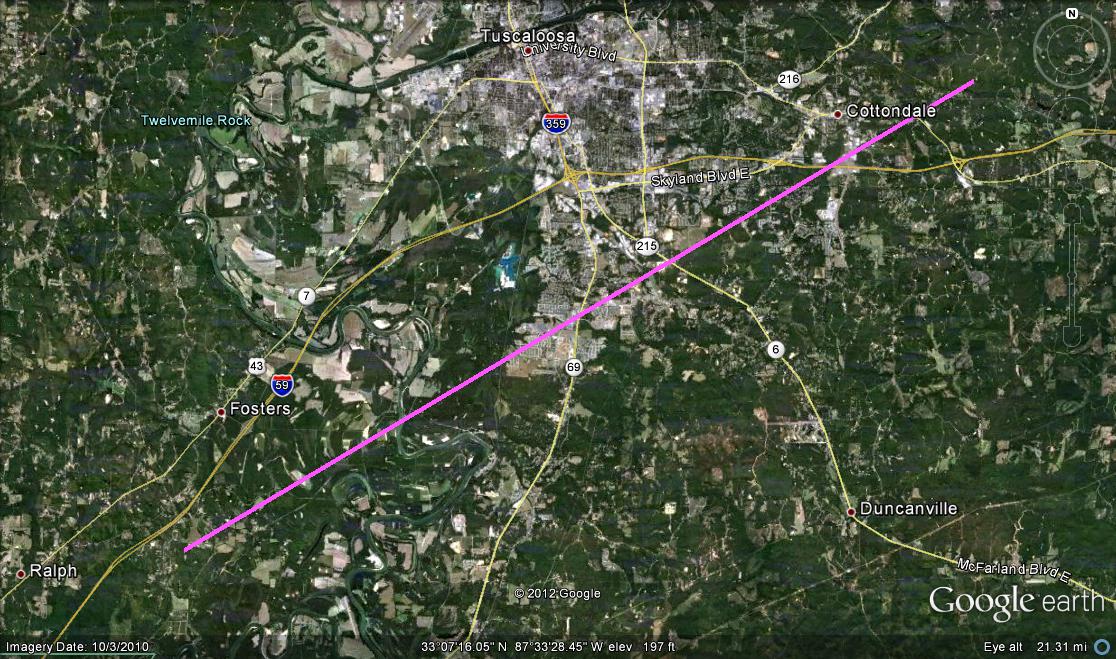
Figure 11: Google Earth map of the Tuscaloosa F4 tornado of 16 December 2000.
Figure 12: 0.5° elevation loop from KBMX on 16 December 2000, 1836-1923 UTC, plotted with GRLevel2 Analyst Edition. Plotted in the loop is reflectivity factor (upper-left), storm-relative mean radial velocity (upper-right), spectrum width (lower-left), and GR2AE’s normalized rotation (NROT) variable. The maximum delta-V of the TVS reached 106.9 knots at 1902 UTC, at which point an enhanced reflectivity factor value appeared juxtaposed with the couplet, likely caused by debris lifted by the tornado.
By the time the tornado had lifted, 11 people had been killed (most in mobile homes), 144 were injured, and $12.5 million in damage had occurred. This tornado was made famous by James Spann, as the old channel 33 microwave towercam, then being operated by ABC 33/40 in Birmingham, captured dramatic video of the violent tornado impacting Tuscaloosa (note: this is not the same camera that captured the 27 April 2011 tornado, but it did also capture an EF3 tornado on 15 April 2011).
James Spann’s video of his coverage from 16 December 2000:
[youtube http://www.youtube.com/watch?v=G3Jyqy7qhsQ]
National Weather Service Birmingham’s summary of the outbreak: http://www.srh.noaa.gov/bmx/?n=event_12162000
SPC Severe Thunderstorm Events Database page, with more meteorological information, including SPC outlooks, watches, and mesoscale discussions from the event: http://www.spc.noaa.gov/exper/archive/event.php?date=20001216
Tony Lyza
Latest posts by Tony Lyza (see all)
- 2014’s EF3+ tornado drought: The latest in the year on record without one - April 8, 2014
- Tornado Damage Surveys and Ratings: Why Pictures Don’t Tell the Whole Story - February 19, 2013
- Quick Update: Tornado Outbreak Likely Christmas Morning through the 26th - December 24, 2012
December 16th 2000 is my birthday!