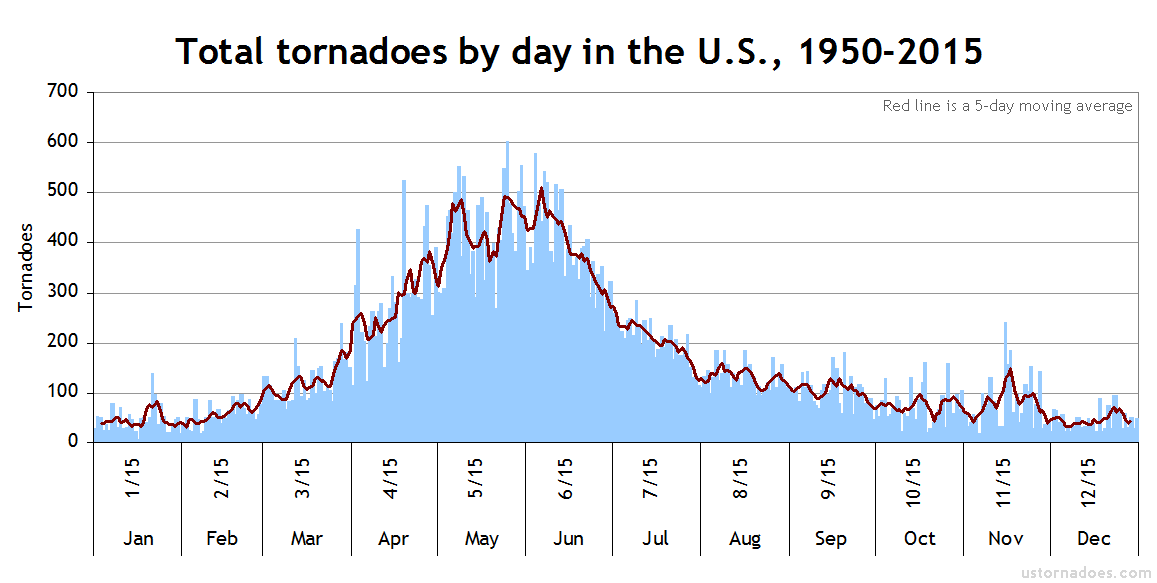
As the “normal” tornado season peaks, I thought it would be interesting to look at which days have seen the most tornadoes and which have seen the fewest.
There aren’t too many surprises in either category. While June can often outproduce May in terms of days with at least one tornado, May is still the time for the largest number outputs overall. Of course April is the leader on any one single day (April 27, 2011) given its tendency for super outbreaks, but those are relatively rare compared to regular tornado events.
There have been 13 days with 500 or more tornadoes since modern records began in 1950. If anything, these numbers are likely under-counted when including the whole record period and thanks to the fact that peak season in the sparser Plains comes during peak overall season.
Still, it’s informative enough to be something of a guide.
70 percent of these top days for numbers fall between mid-May and mid-June. That is basically the go to sweet spot for tornado activity in the long run.
May 25 tops the list, the only day surpassing 600 total tornadoes, with 603 as of the 1950-2015 period.
Broadening out to the top 50 days for cumulative tornadoes, we find May with a slight lead over June in overall days at 48 percent to 40 percent. April places a distant third at 12 percent.
On the flip side, the lowest number days are where you’d expect as well. They entirely occur during the cool season, although it is not only winter which has them.
Of the 16 days with fewer than 25 tornadoes in total, all but two are during the winter. Perhaps surprisingly, October 19 makes the list as does November 11. These months are often thought of as “second season,” but you can tell from the numbers that second season is not nearly as regular as first season.
The quietest tornado day from 1950-2015 has been January 16. It has seen only 7 tornadoes during the period!
As far as a bottom 50 breakdown, five months are in play. December and January days are favored when it comes to low tornado numbers. 34 percent have come in December, and 30 percent in January. November is in third at 14 percent, then February at 12 percent and October at 10 percent.
All the days with more than 500 tornadoes
Now that we know where to look for the days with the most and least tornadoes, it might be fun to know how they look.
I’ve gone ahead and created maps of the top 13 dates for tornado numbers. Maybe in the future I’ll come back to the low dates, but they don’t look too interesting so I skipped them here!
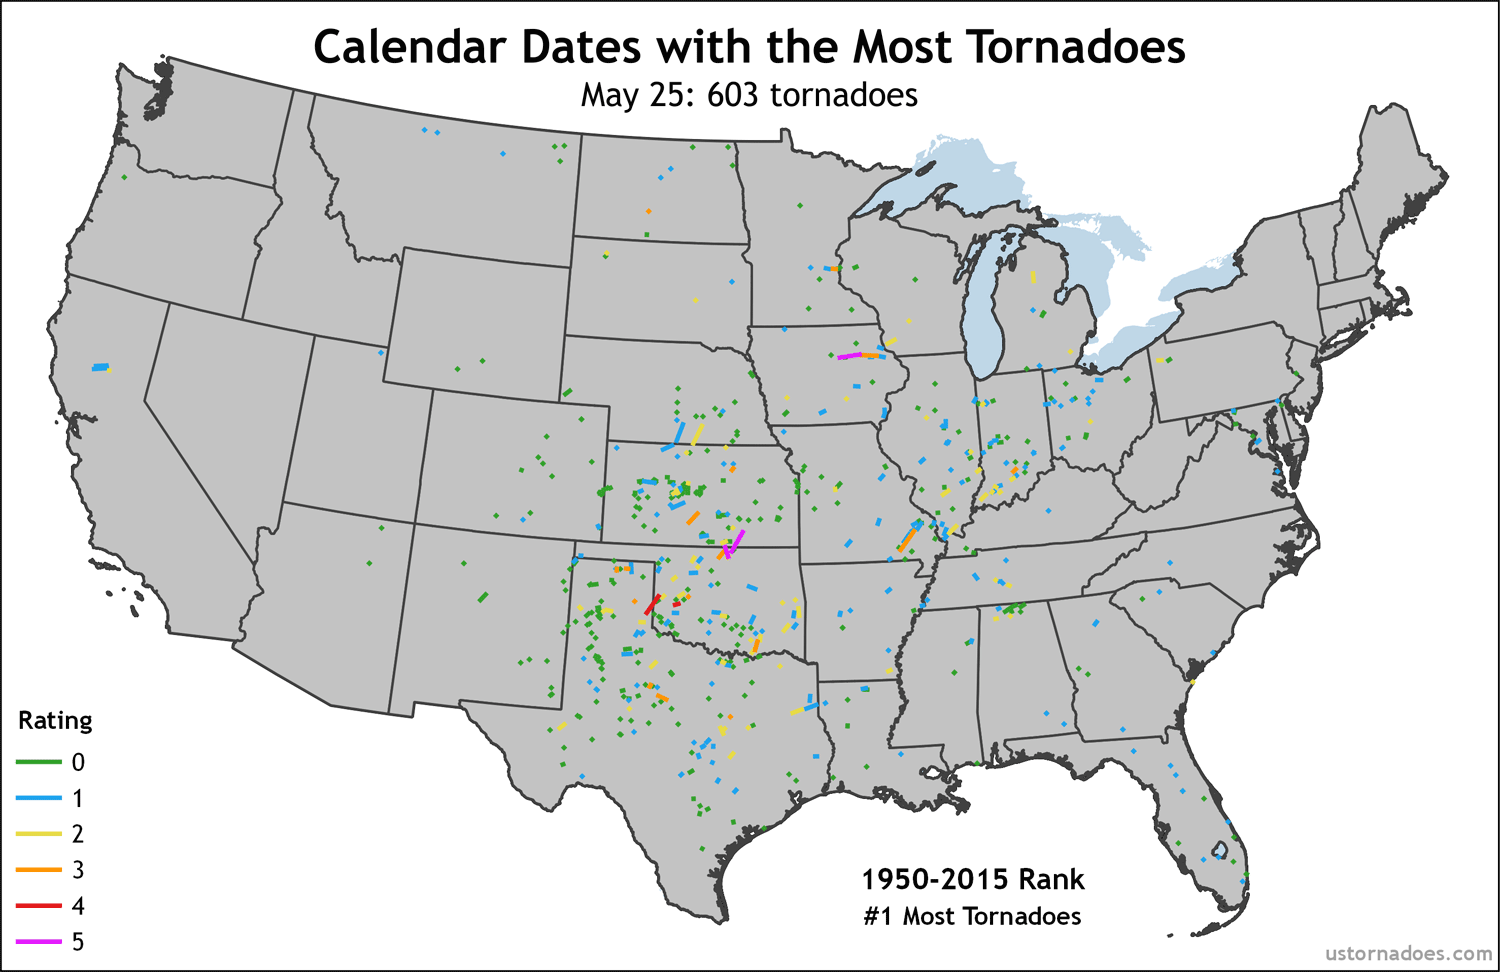
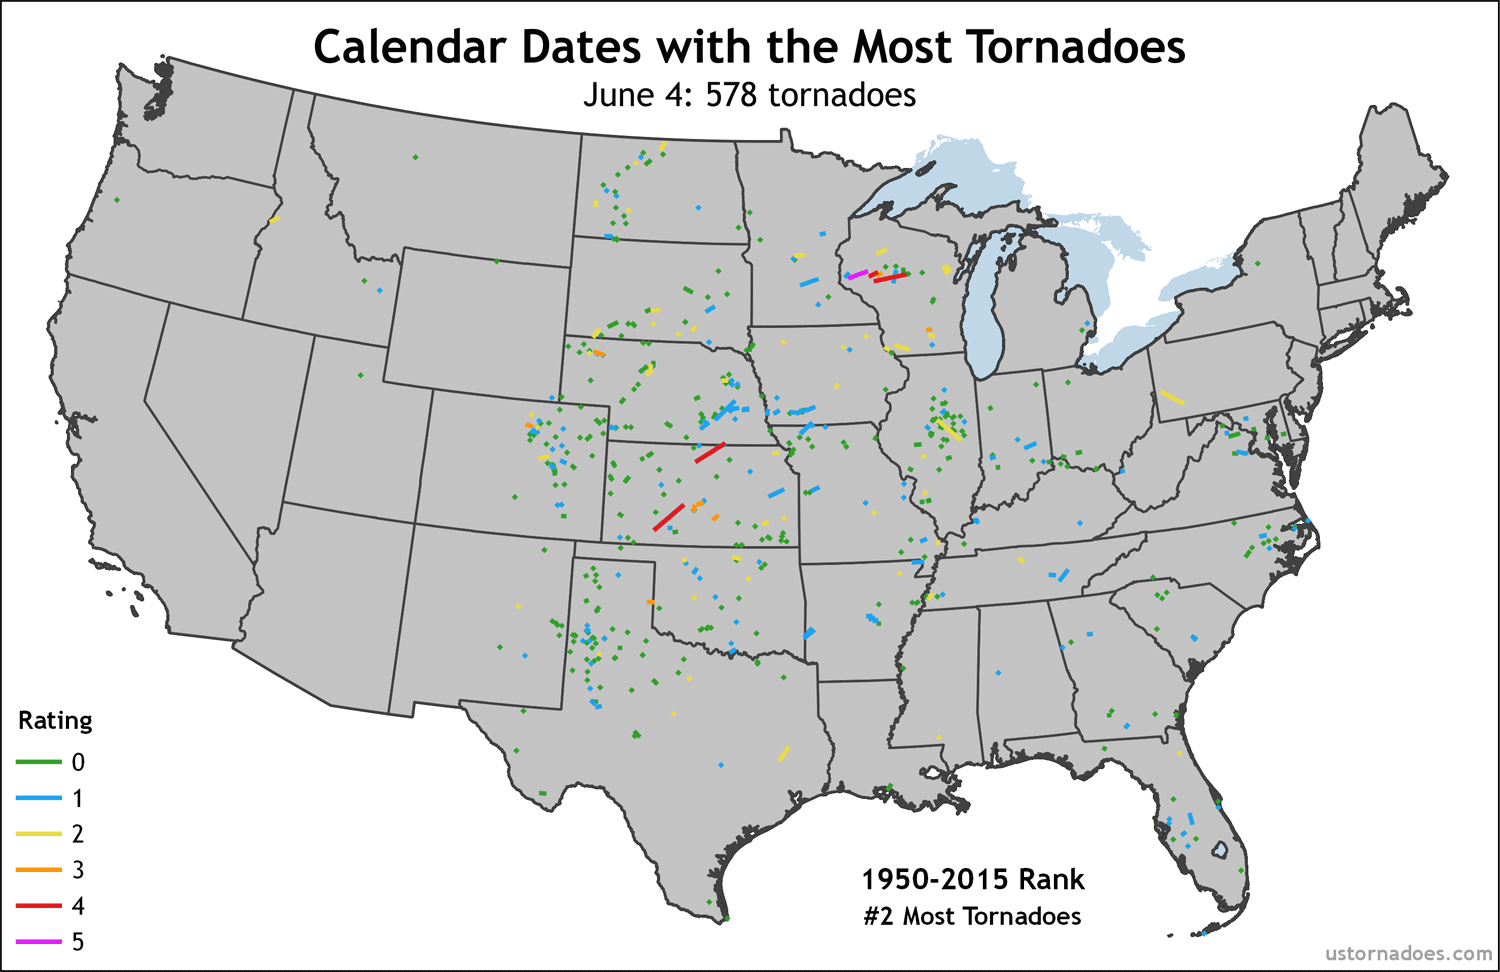
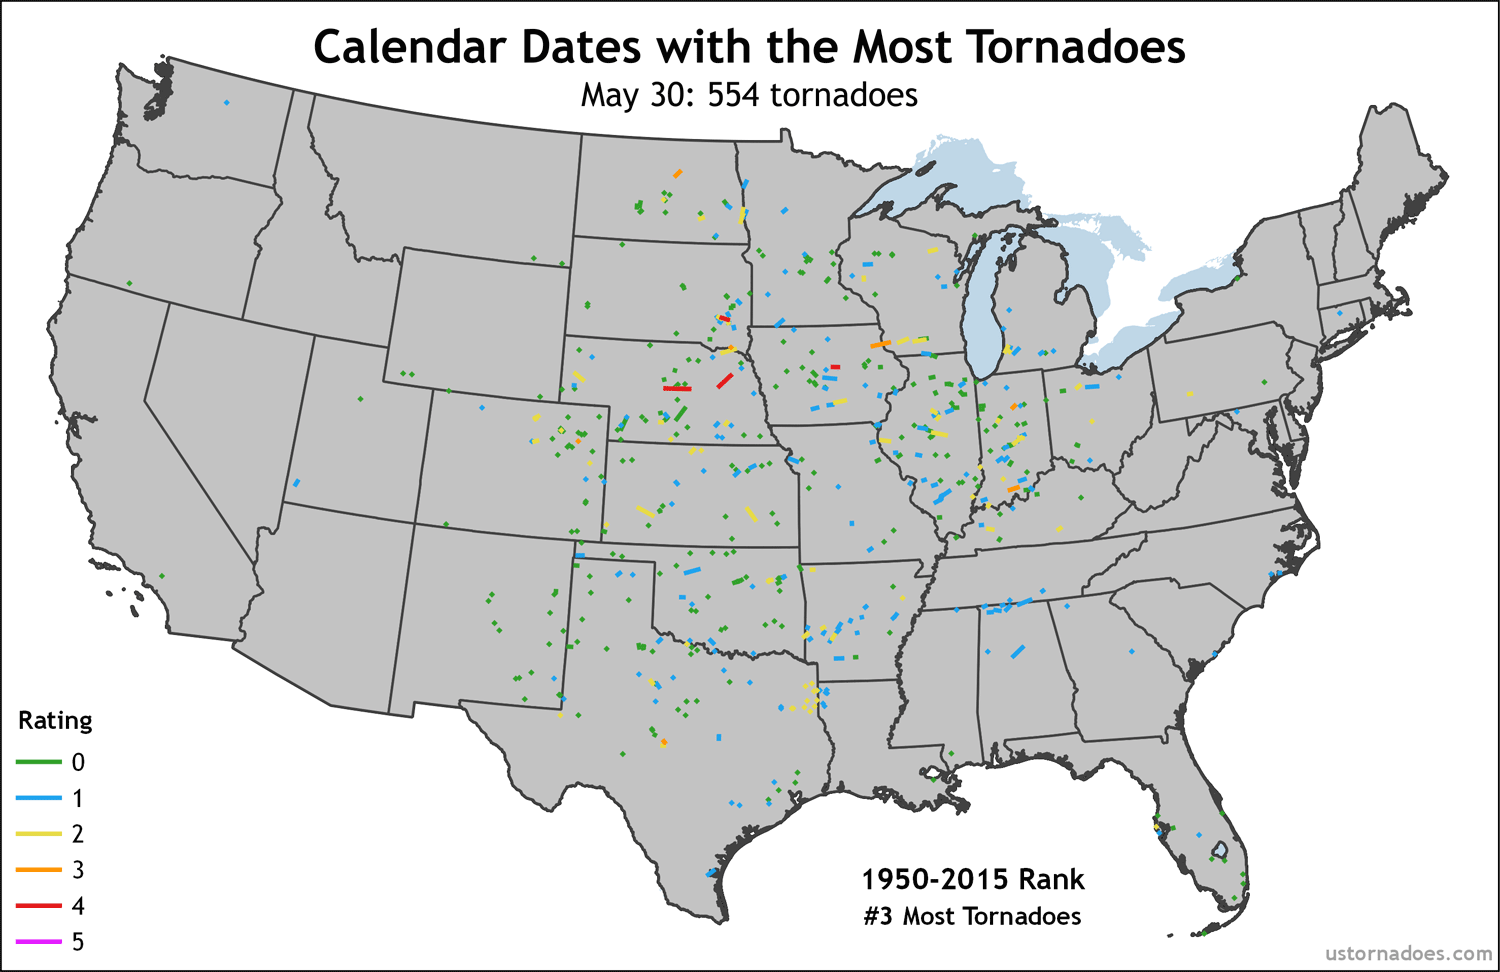
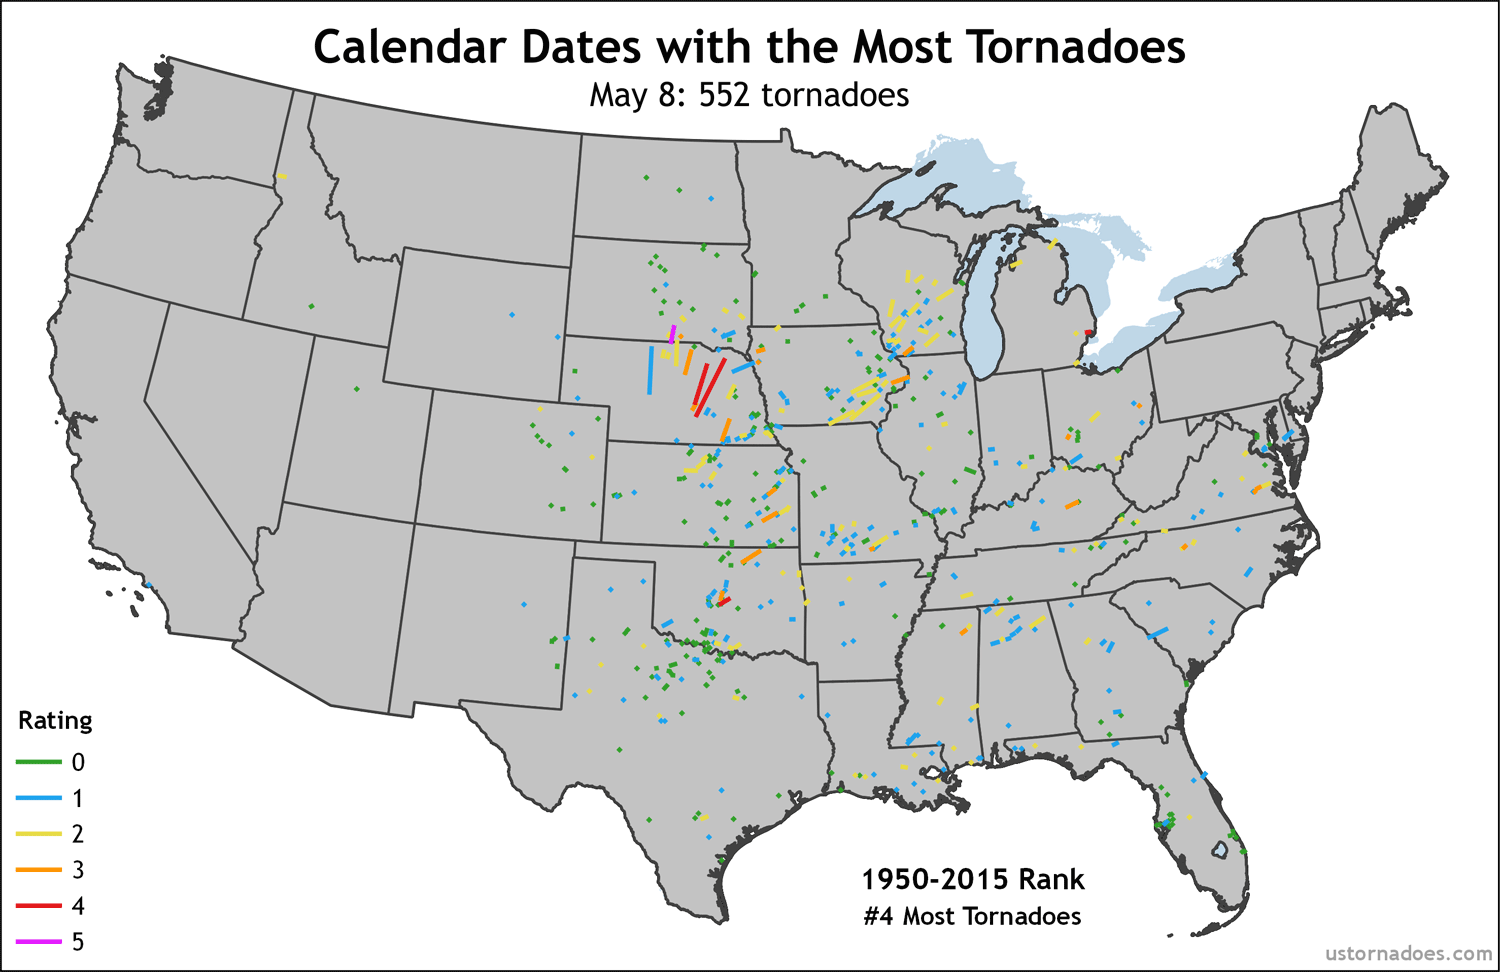

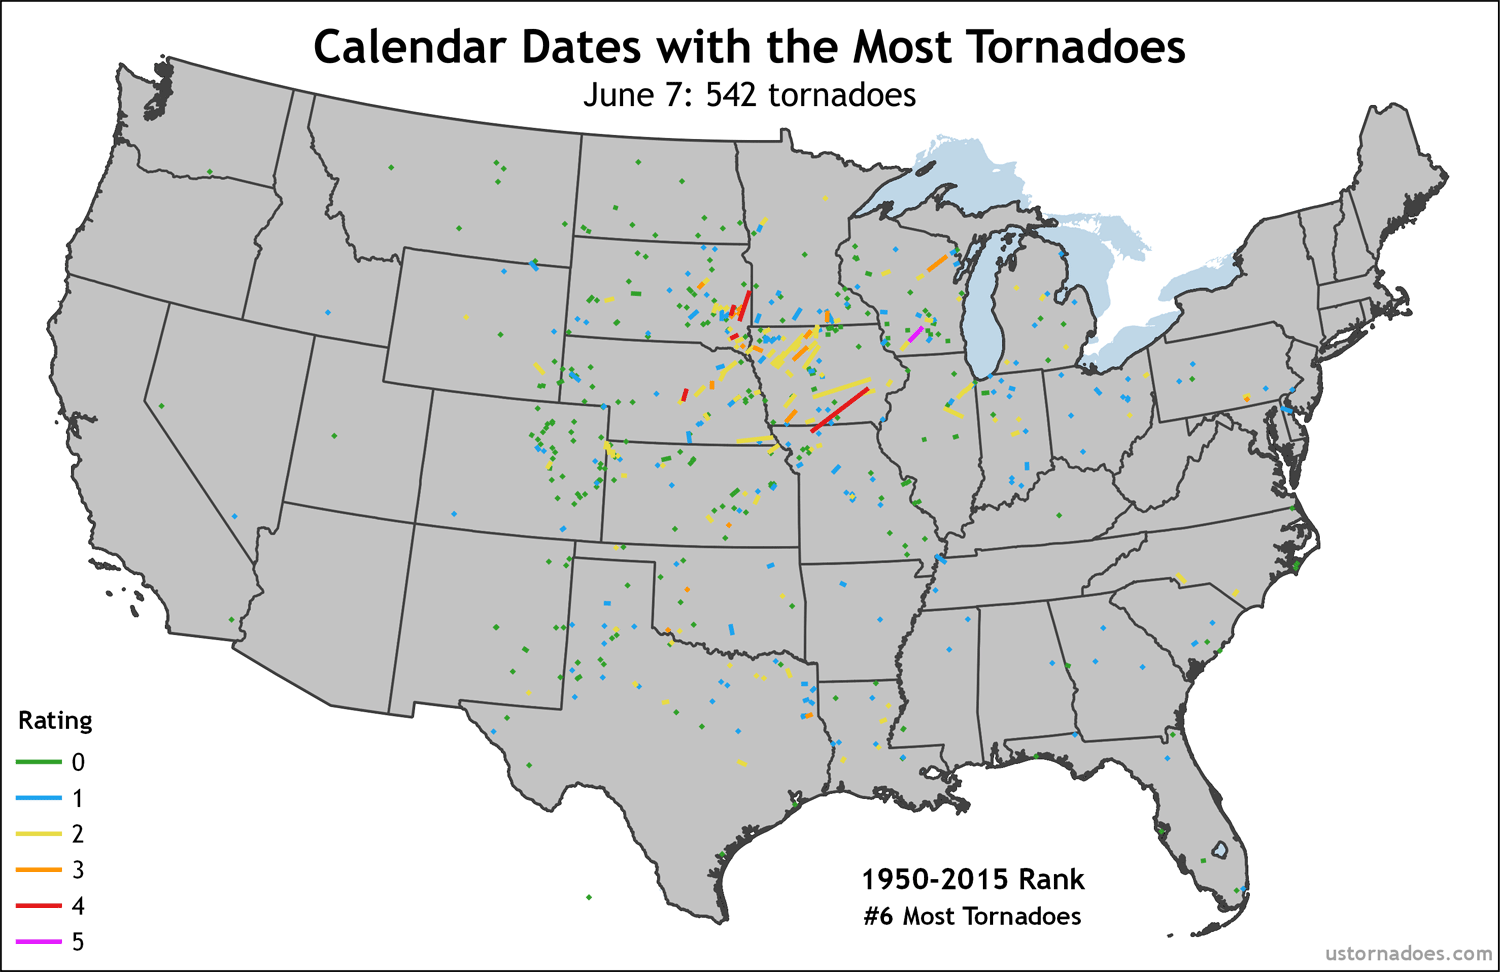
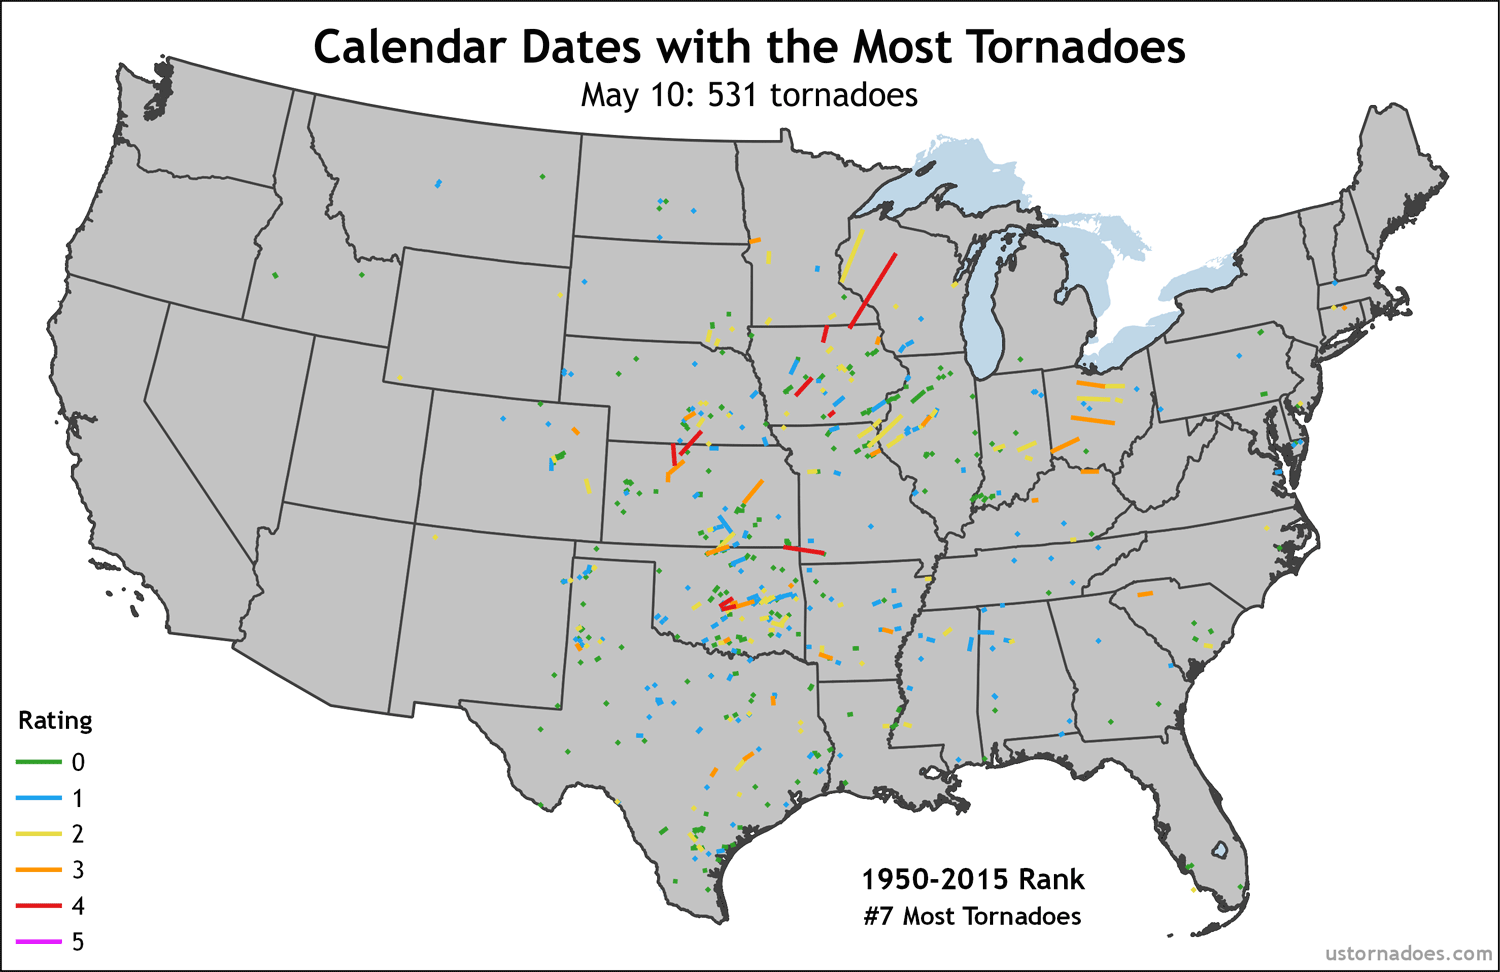
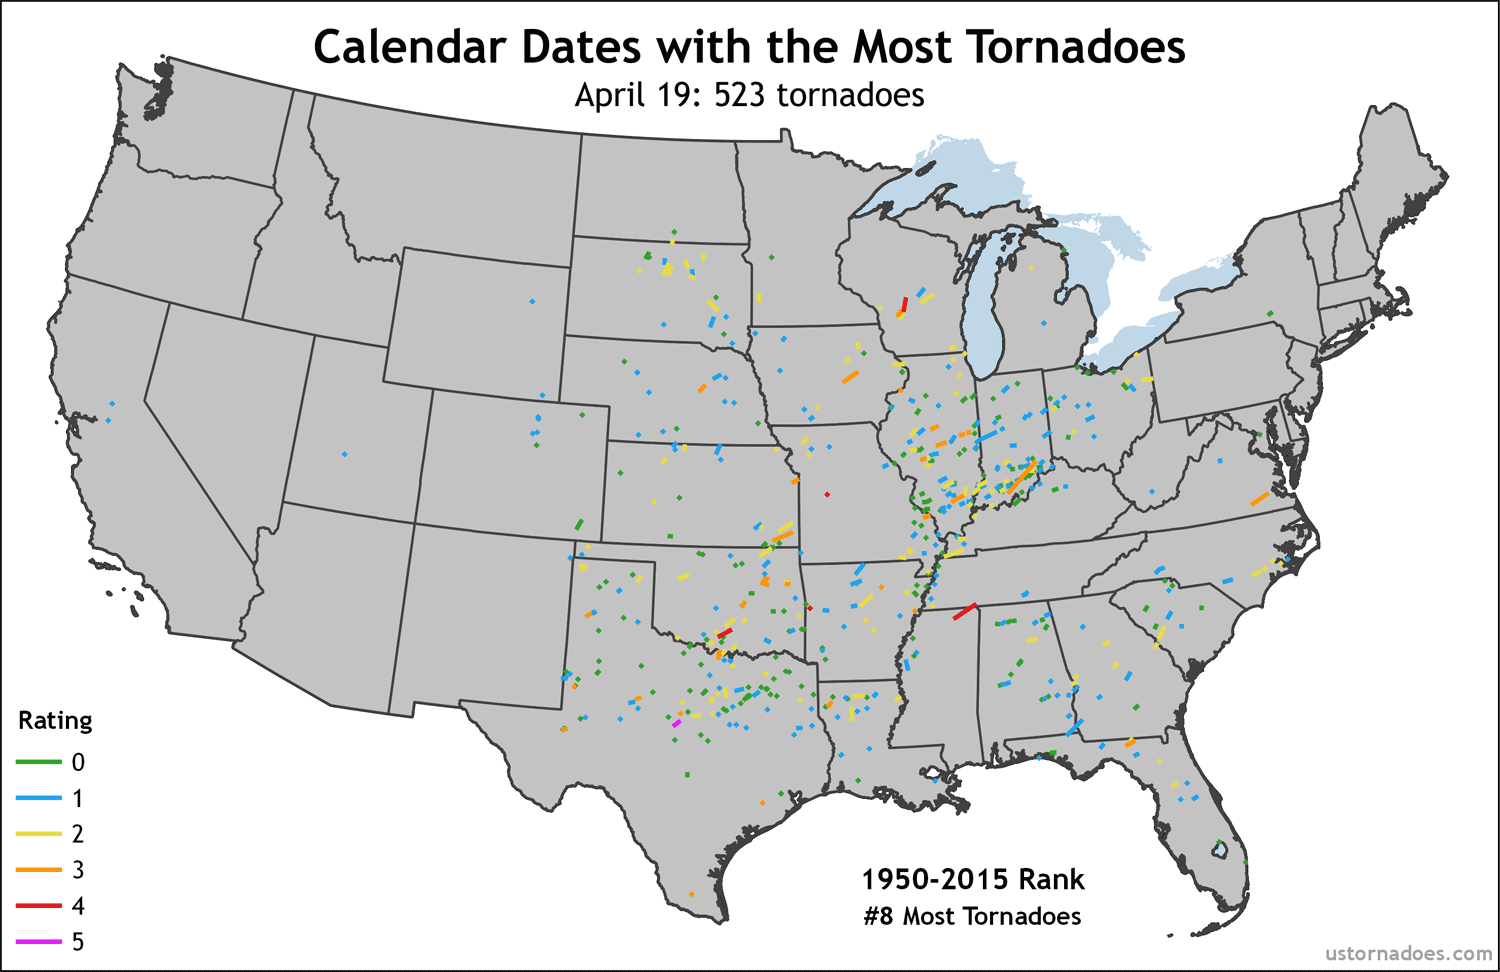

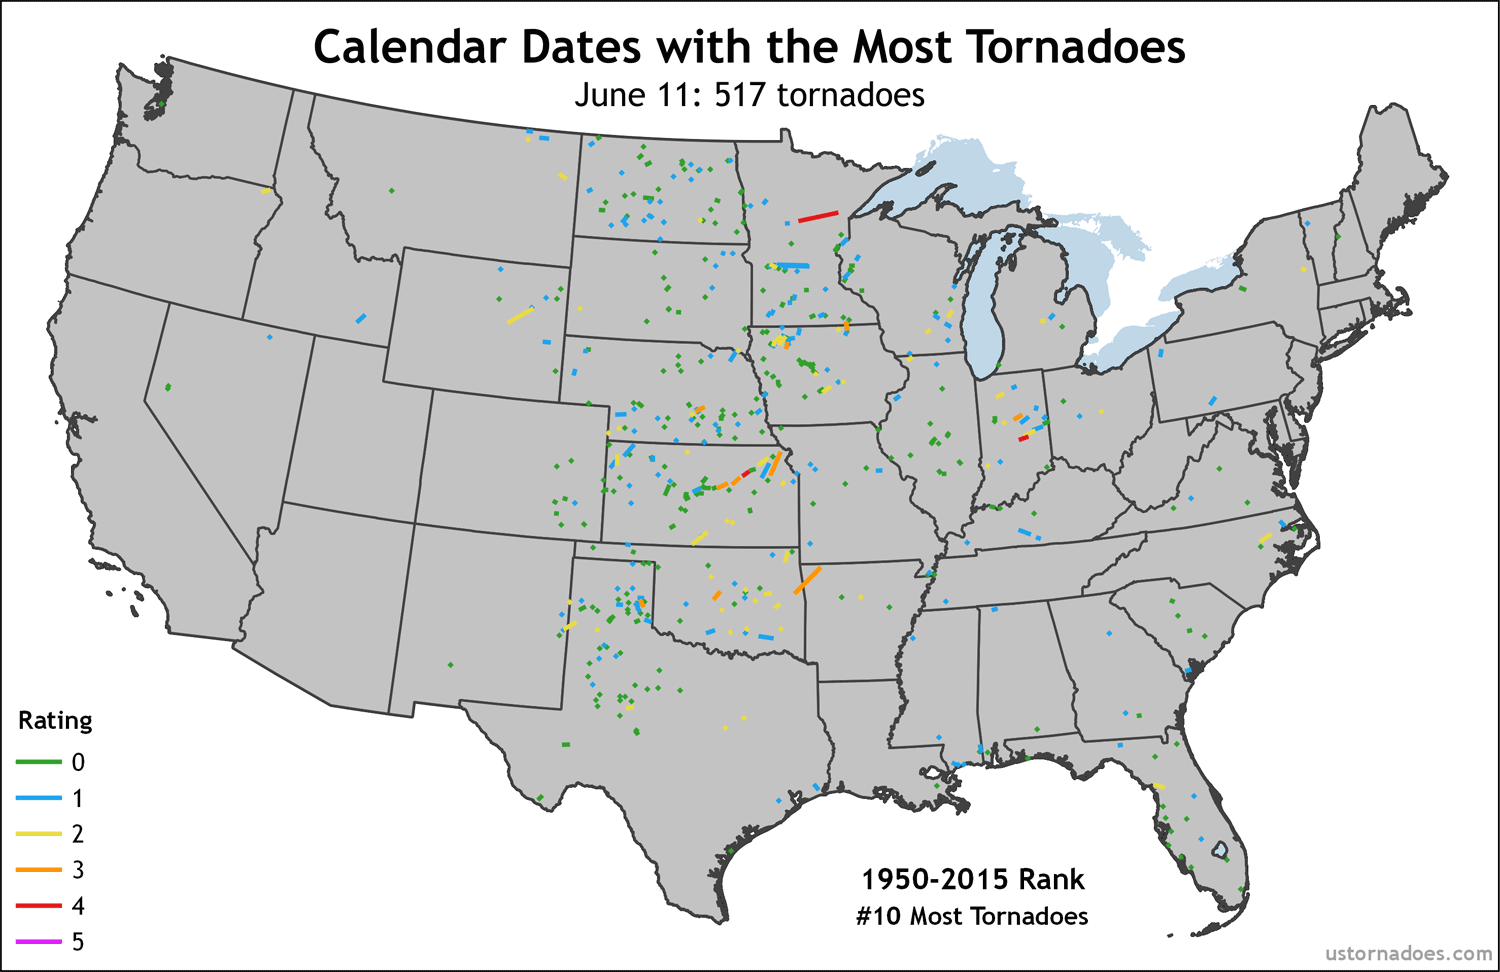
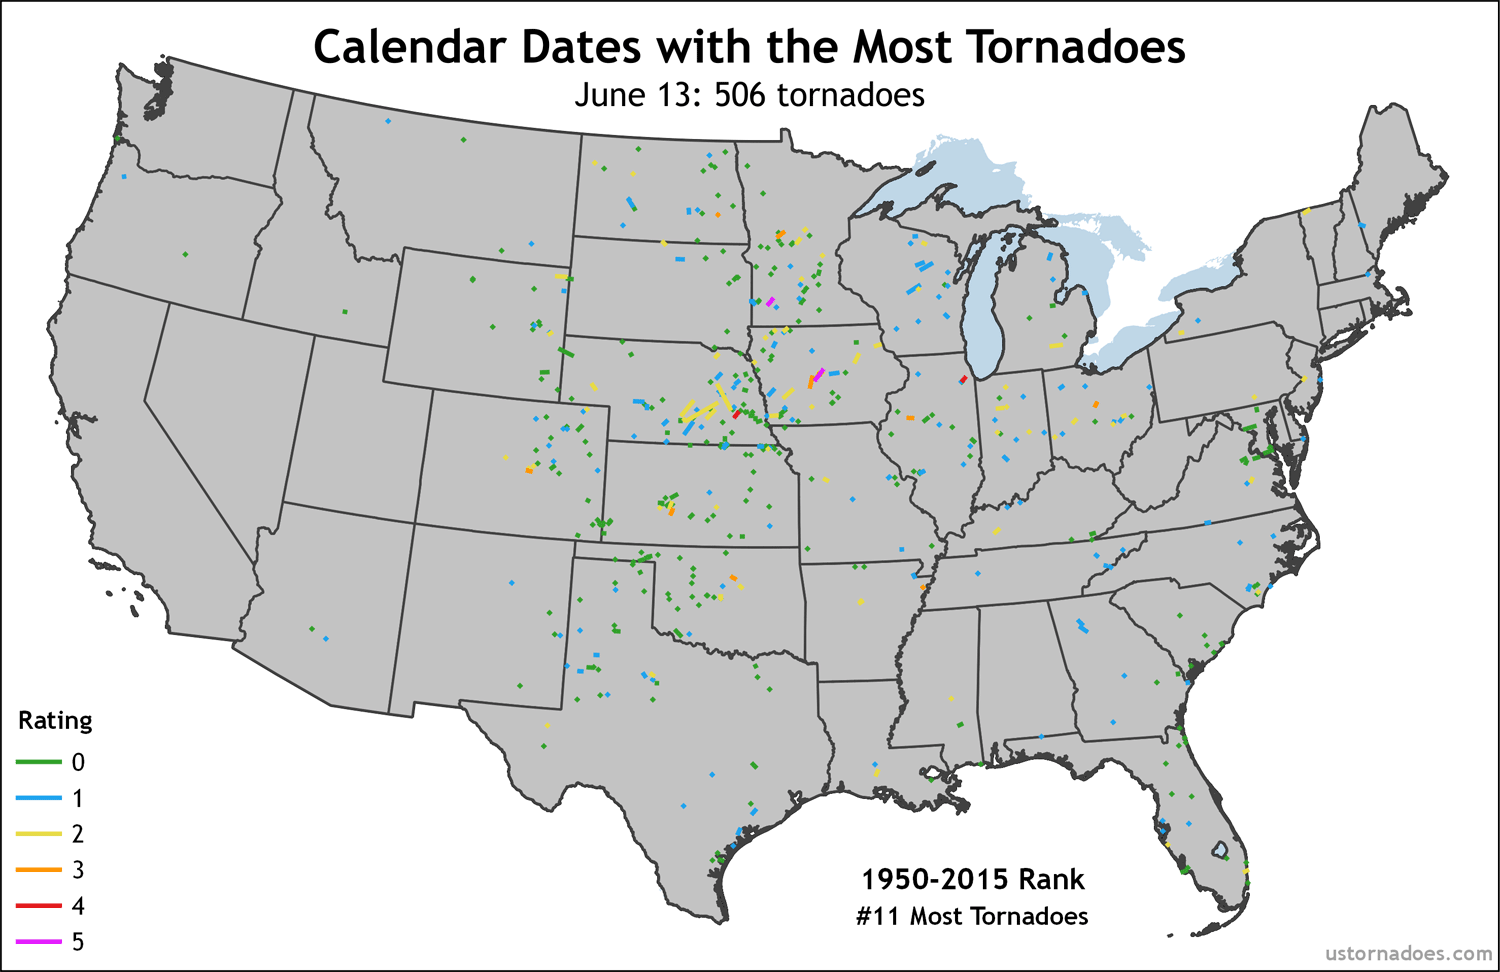


You can also grab the full sizes of each here (listed in order from high to low): May 25, June 4, May 30, May 8, May 24, June 7, May 10, April 19, June 8, June 11, June 13, May 29, May 7.
Latest posts by Ian Livingston (see all)
- Top tornado videos of 2023 - January 1, 2024
- March 31, 2023 tornado outbreak videos - March 31, 2023
- Top tornado videos of 2022 - December 31, 2022