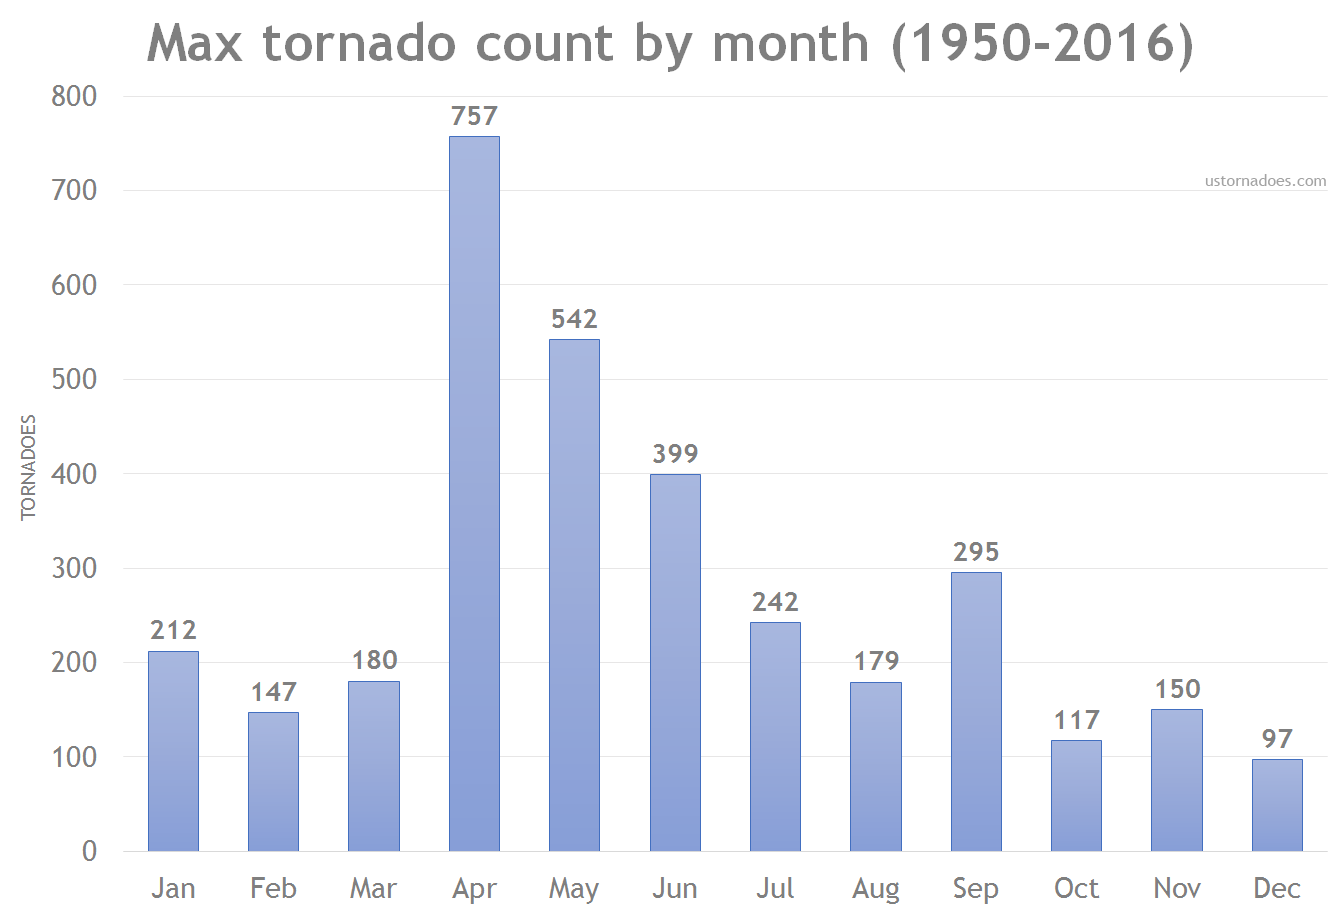
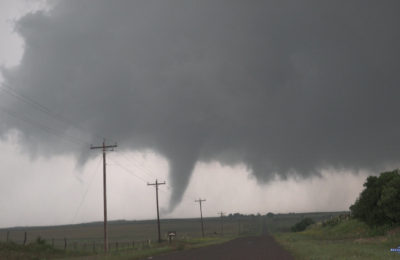
As spring knocks on the door, tornado season is thinking about revving up. But of course, tornadoes are a year-round thing. It’s just a matter of frequency.
While a “low pressure west/high pressure east” weather pattern is the gist of what you look for most of the time when it comes to active tornado periods, there are nuances from month-to-month as the calendar changes from cold to warm and back to cold again.
Given a heavy focus on 500 mb height anomalies, this is one of those in-the-weeds-geek posts. It also probably argues for more of an explanation than is presented here. Alas, I am a sucker for pattern recognition, so it had to be done.
The main idea is that the cool colors are lower temperatures than normal, and the warm colors are higher temperatures than normal. These are temperatures measured in the middle atmosphere.
In general, when you see deep blues (negative heights compared to normal), there is a consistent signal for lower pressure in that region. Usually the core is something of a pivot zone. Often storms that impact weather at ground level will rotate around it like spokes on a wheel. The oranges (positive heights compared to normal) indicate warm temperatures and stubborn high pressure. The darkest color is not necessarily the center of the surface high, but it is closely correlated. Lower than normal heights are often referred to as “troughing”, and higher than normal heights is known as “ridging”.
Confusing? If you haven’t seen these maps before it can be. The 500 mb pattern (heights, vorticity, etc.) is the key driver, and perhaps the most important weather level to know about other than where we live. If you’re curious and new to it all, this is a great place to start.
One thing seen across almost all of the samples is that more high pressure than normal is frequent in the eastern United States during big tornado months. This high pressure acts as a source of both warmth and moisture for the numerous storm systems charging at it from the west. As air flows clockwise around the area of high pressure, southerly winds on the west side of it draws up the moisture-abundant air over the Gulf of Mexico into the United States.
Before continuing, keep in mind that these are composites of the top 10 years for each month. There are other patterns which will produce tornadoes, this just highlights the favored looks.
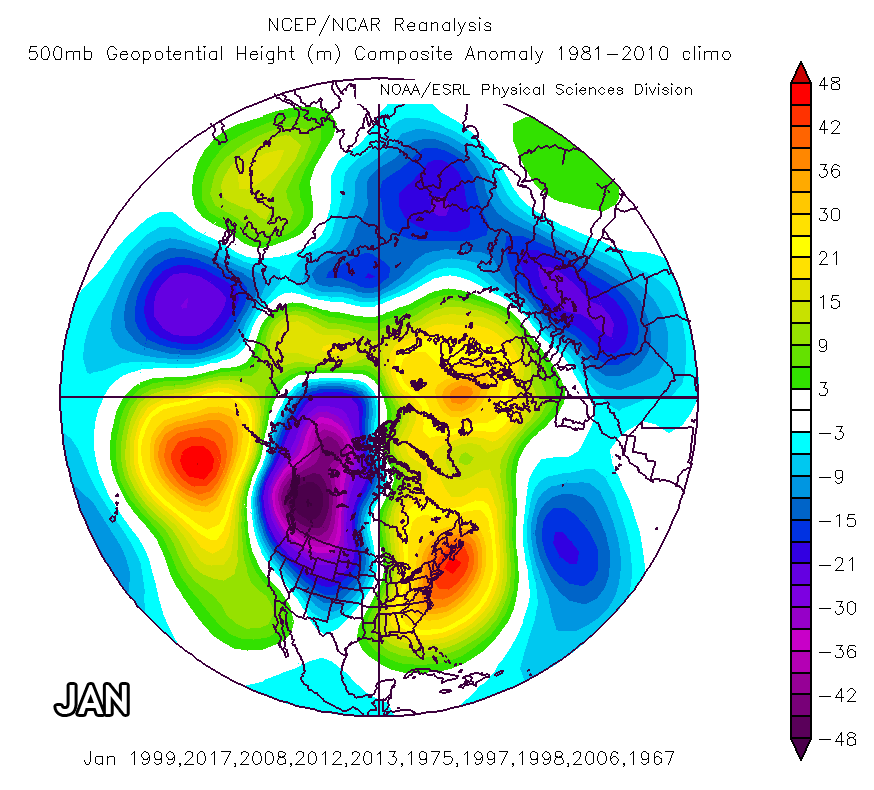
January, like other wintertime months, tends to have the strongest atypical signatures, hence the bright oranges and deep purples (progressing through the months here, you’ll notice warmer seasons generally have smaller anomalies, and that all the maps use the same scale). In this case, a southwest Canada vortex sends frequent storminess into the western U.S. before it bumps into atypical warmth out east.
Year, tornado total; 1999, 212; 2017, 140+; 2008, 84; 2012, 79; 2013, 75; 1975, 52; 1997, 50; 1998, 47; 2006, 47; 1967, 39
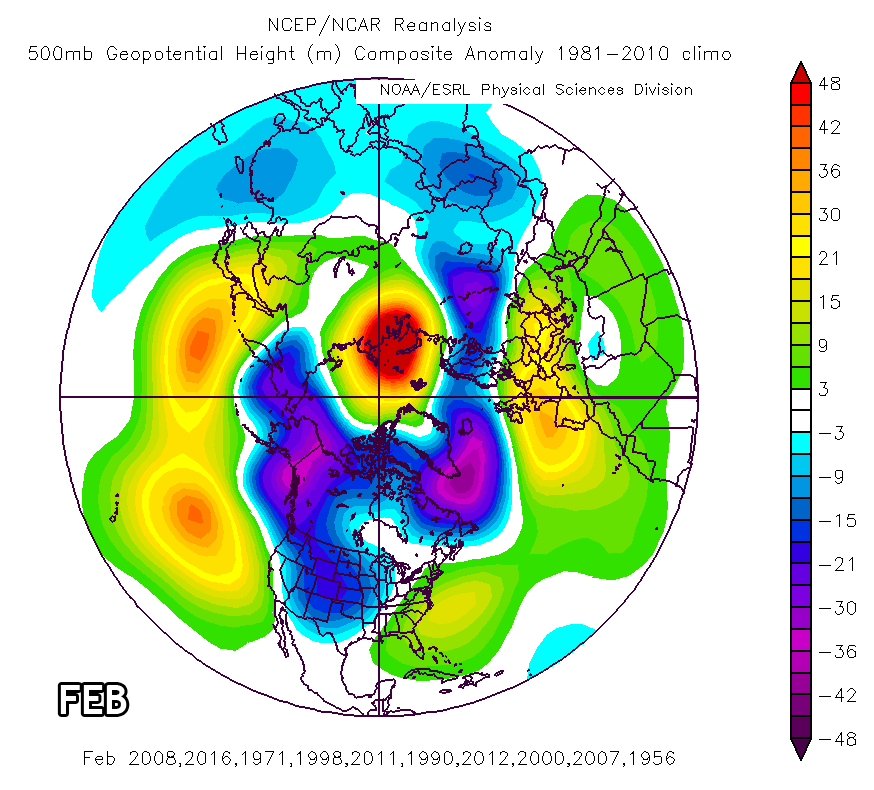
The pattern in February doesn’t look too different from the month prior. A dominant storm track from the Pacific Northwest, and through the Rockies, then up into the Great Lakes is supported by general western U.S. troughing and a ridge off the East Coast.
Year, tornado total: 2008, 147; 2016, 100+; 1971, 83; 1998, 72; 2011, 63; 1990, 57; 2012, 57; 2000, 56; 2007, 52; 1956, 47
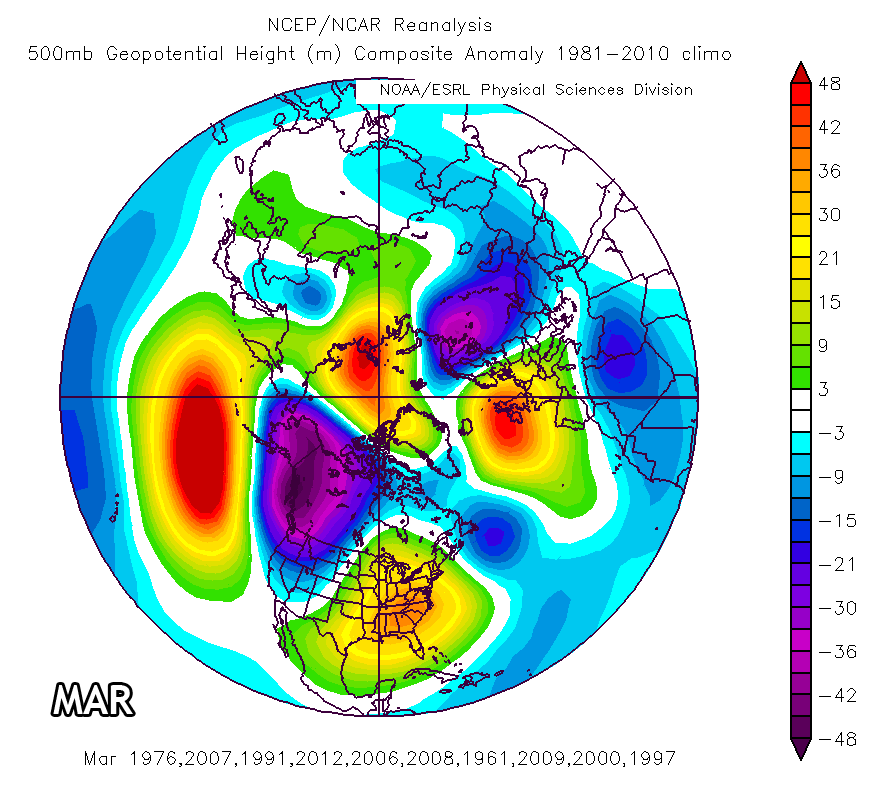
As we head into March, the East Coast ridge can flex more and more with the onset of spring. The ridge tends to build in farther west than in prior months, which helps warm and moist Gulf of Mexico air flood the eastern third of the country during active tornado periods.
Year, tornado total: 1976, 180; 2007, 170; 1991, 157; 2012, 155; 2006, 147; 2008, 129; 1961, 124; 2009, 115; 2000, 103; 1997, 102
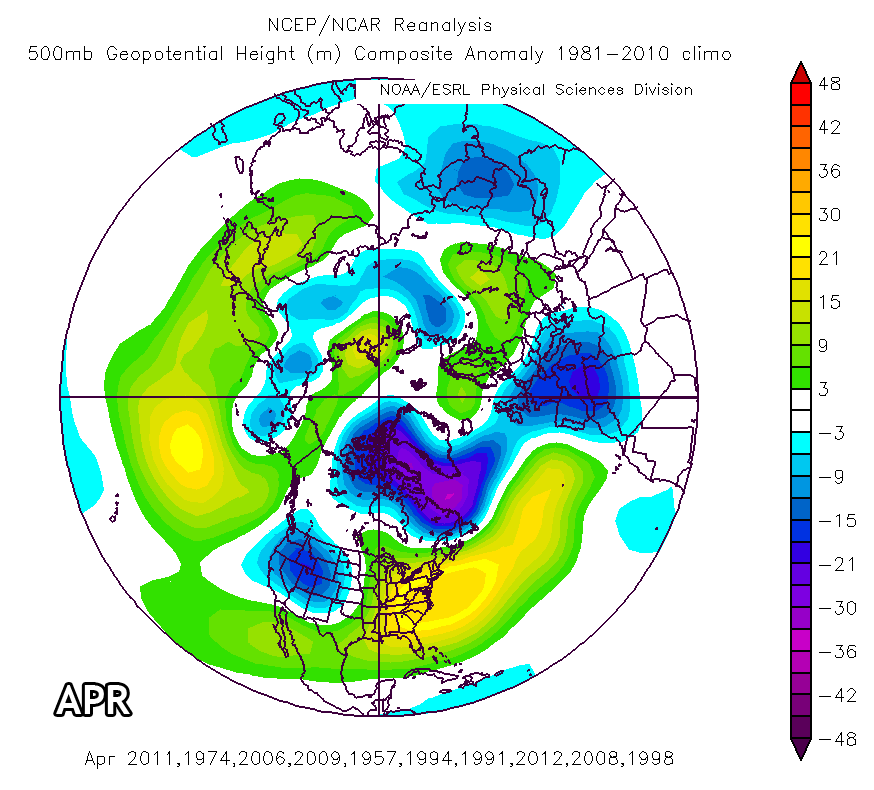
Peak season begins in April, and a big April tends to come with uninterrupted moisture streaming in off warm water. During the most violent of Aprils, the southeast ridge is dominant and often extends out into the Atlantic. The winter jet stream is weakening overall out west, but its orientation is often just right to spin up massive cyclones over the central U.S. There’s even a hint of a neutral to negative tilt to the trough/ridge axis on the big ten above. A sign of April’s explosiveness.
Year, tornado total: 2011, 757; 1974, 267; 2006, 244; 2009, 226; 1957, 216; 1994, 205; 1991, 204; 2012, 204; 2008, 189; 1998, 182
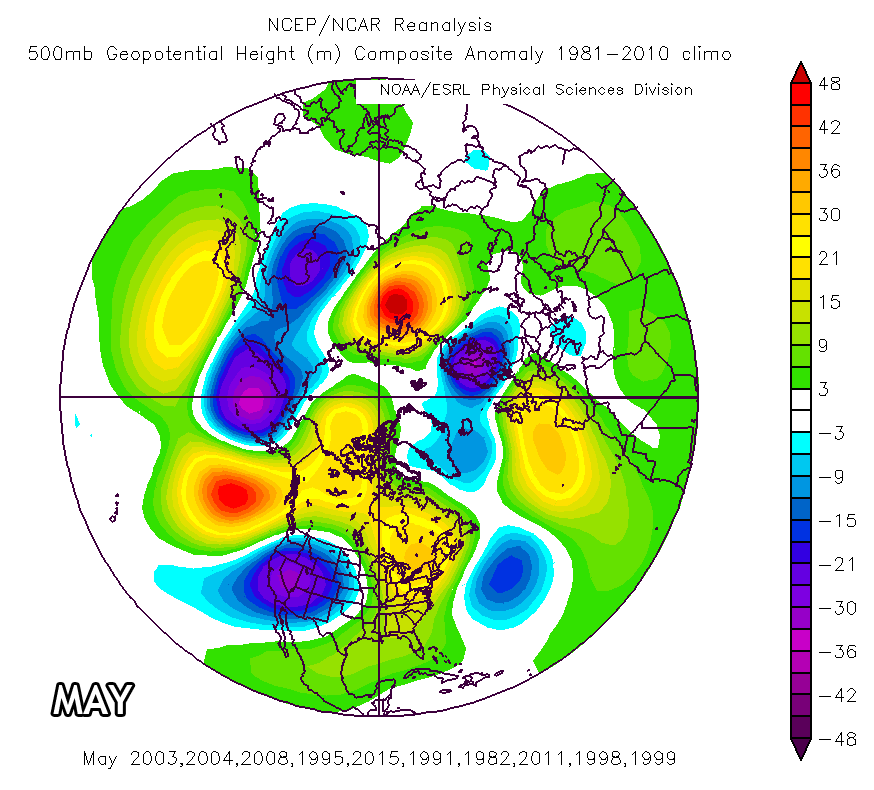
May is known as the peak of the peak. It’s got at least some of April’s punch, plus the increased warmth of summer around the corner. It also can feature meandering jet stream characteristics that can set up volley after volley (after volley) of tornadoes. Storm chasers will agree, modest southwest flow over air from the Gulf can do big things. The full trough ejections can turn it up a level, or three.
Year, tornado total: 2003, 542; 2004, 509; 2008, 460; 1995, 394; 2015, 381; 1991, 335; 1982, 329; 2011, 326; 1998, 310; 1999, 310
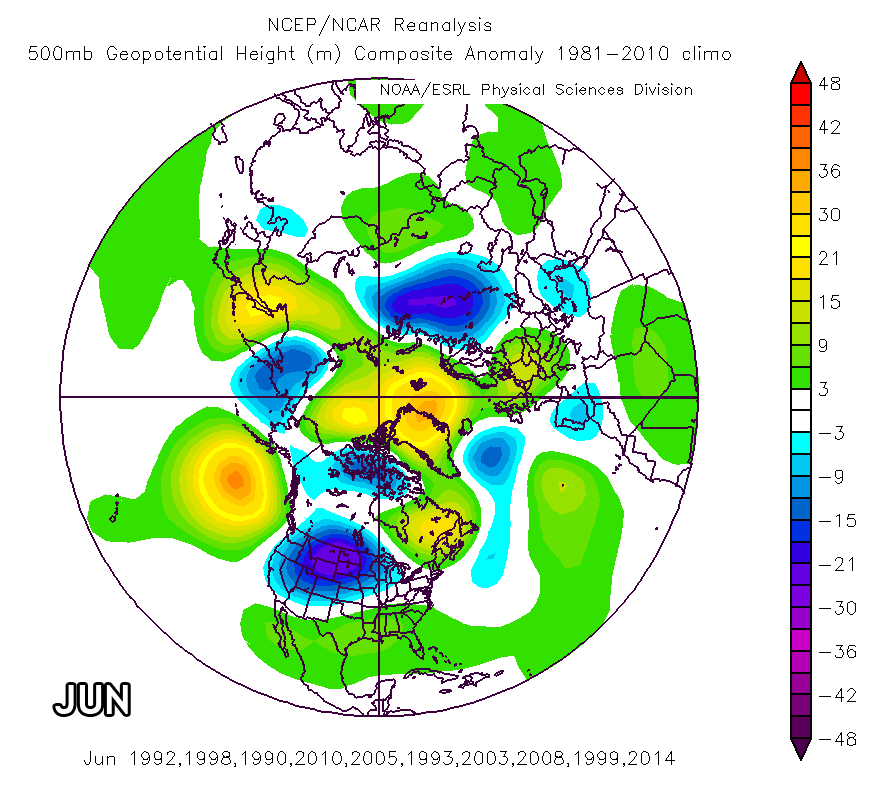
Something of a sleeper month, June can be yuge or blah. By this time of year, it’s mostly about the northern half of the country. High pressure begins to take over the southern U.S. as peak summer nears. Big years tend to feature unusual storminess across the central to northern Plains and Midwest.
Year, tornado total: 1992, 399; 1998, 376; 1990, 329; 2010, 321; 2005, 317; 1993, 313; 2003, 292; 2008, 290; 1999, 289; 2014, 286
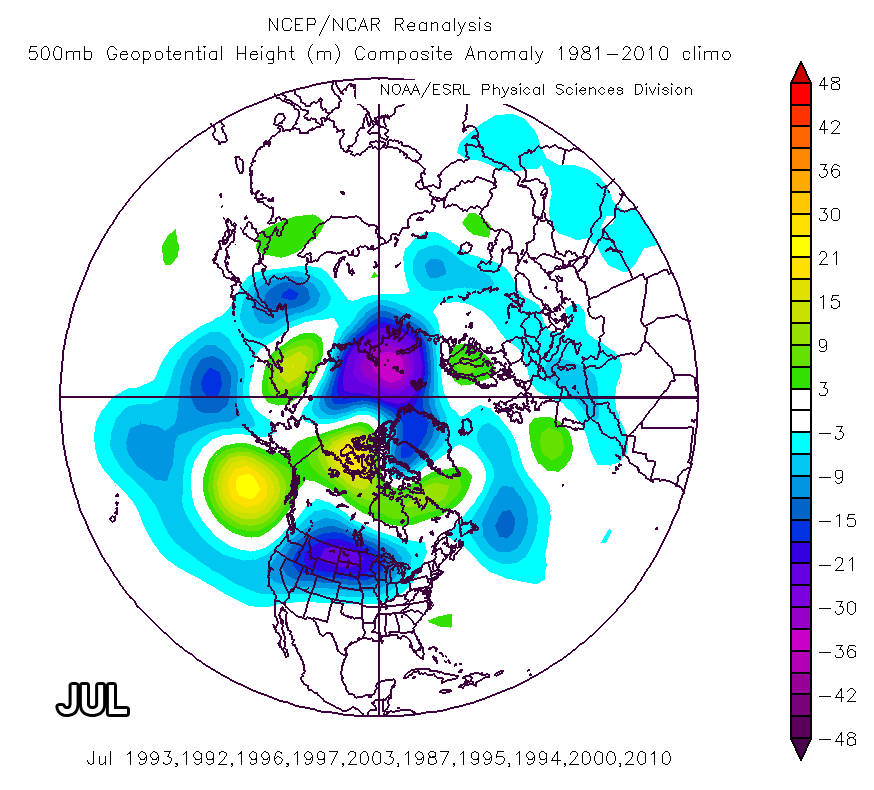
July is much like June. The areas where low pressure tends to be unusually strong during big tornado months are quite similar. The focus is again on the Northern Tier of the United States and into Canada.
Year, tornado total: 1993, 242; 1992, 213; 1996, 202; 1997, 188; 2003, 167; 1987, 163; 1995, 162; 1994, 155; 2000, 148; 2010, 146
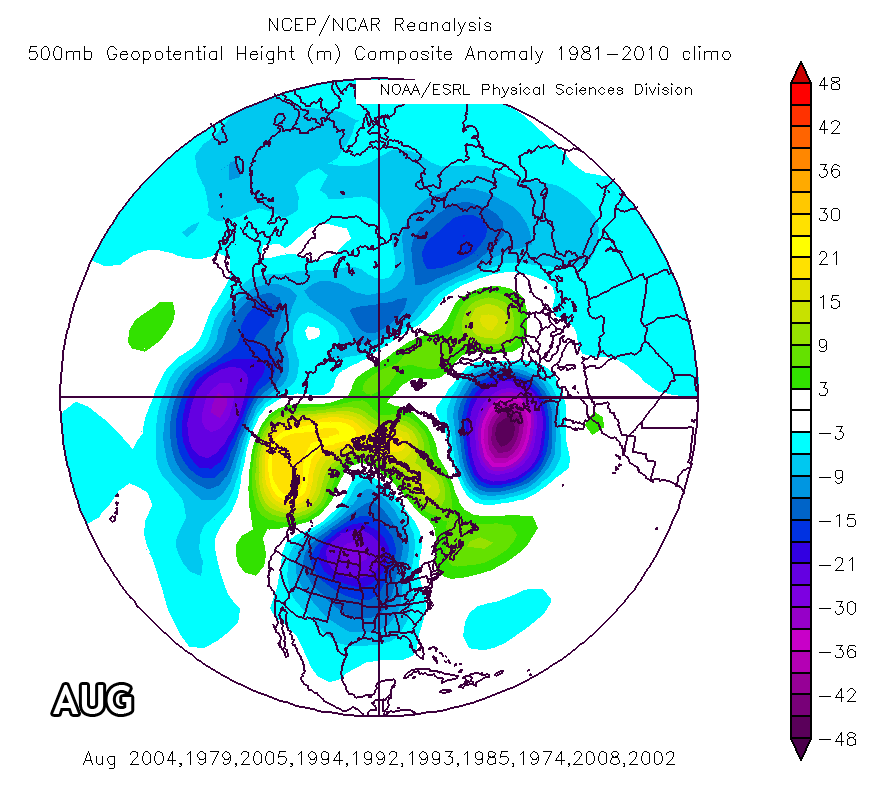
August fits in well with the other summer months, at least as far as where storminess is focused. The center is shifted a bit east, and overall there is a tendency for lower pressure than normal in most of the lower 48. Tornadic storms become more of an exception than a rule, but they are possible just about anywhere. Hints of tropical activity also appear with cold mid-level anomalies pointed at Florida from the Atlantic.
Year, tornado total: 2004, 179; 1979, 126; 2005, 123; 1994, 120; 1992, 115; 1993, 112; 1985, 108; 1974, 107; 2008, 101; 2002, 86
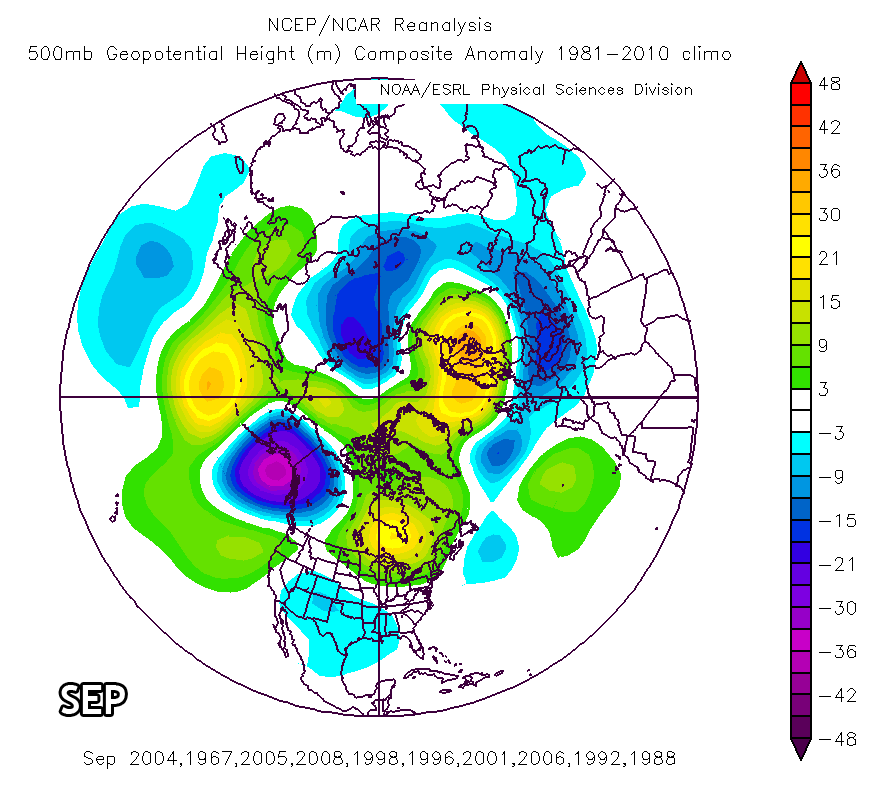
It’s often a quiet tornado month, but September also has a big tropical upside. A pattern generally favorable for Gulf of Mexico storms is somewhat apparent in the height pattern. Big years on this list include those which housed Major Hurricane Ivan (2004), the most prolific tropical tornado producer on record, and the devastating Major Hurricane Katrina (2005) among others.
Year, tornado total: 2004, 295; 1967, 139; 2005, 133; 2008, 111; 1998, 104; 1996, 101; 2001, 84; 2006, 84; 1992, 81; 1988, 76
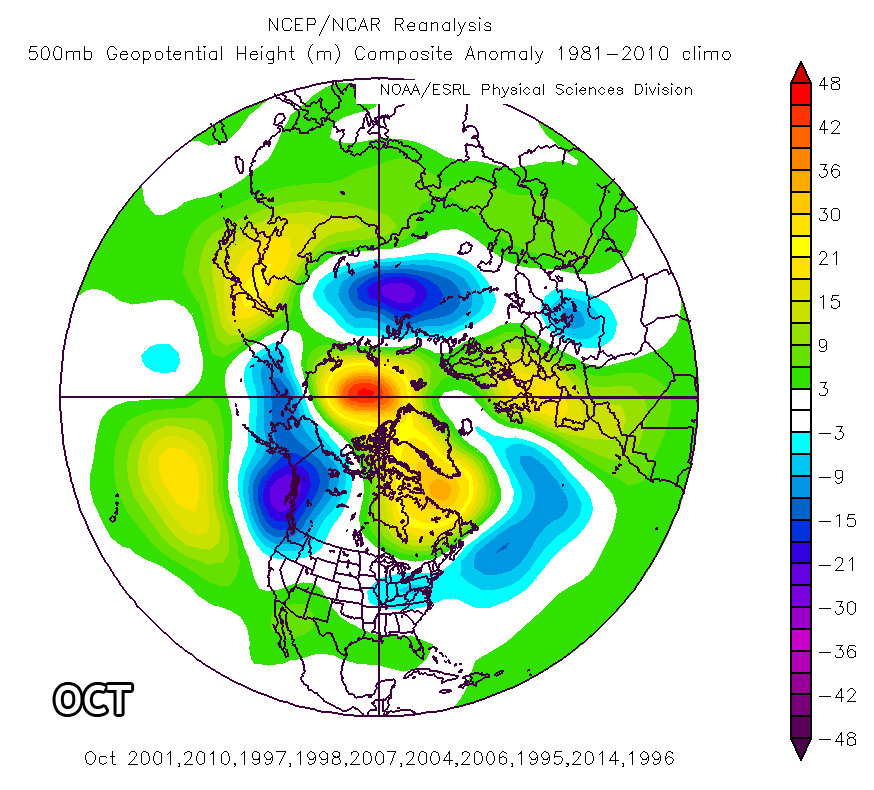
Once we get into October, “second season” creeps into the mind. In reality we’re usually seeing the end of the tropical tornado threat and the start of the return of cooler season jet streams. Increasingly frequent mid-latitude storm systems roll across the country, carving through the waning warmth of summer.
Year, tornado total: 2001, 117; 2010, 108; 1997, 100; 1998, 86; 2007, 86; 2004, 79; 2006, 76; 1995, 74; 2014, 73; 1996, 68
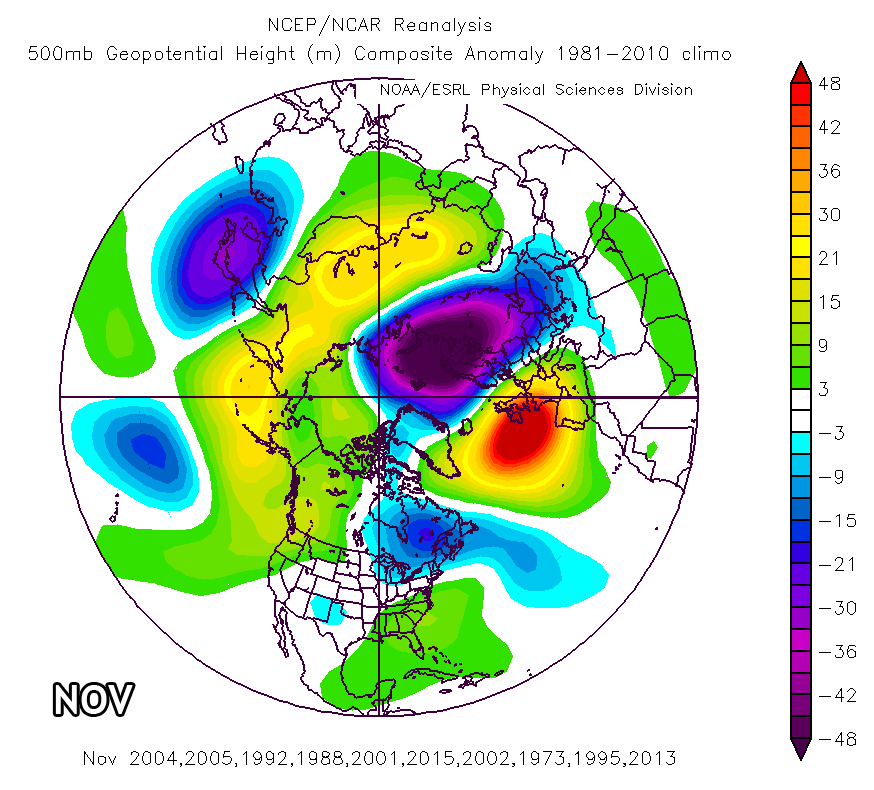
Some of the biggest cool-season outbreaks have come in November. There’s still ample warmth over the Gulf and Caribbean when the southeast ridge flexes. The cool season jet stream starts digging more and more as well. Sometimes the two pair up right for big things.
Year, tornado total: 2004, 150; 2005, 149; 1992, 146; 1988, 121; 2001, 110; 2015, 99; 2002, 94; 1973, 81; 1995, 79; 2013, 79
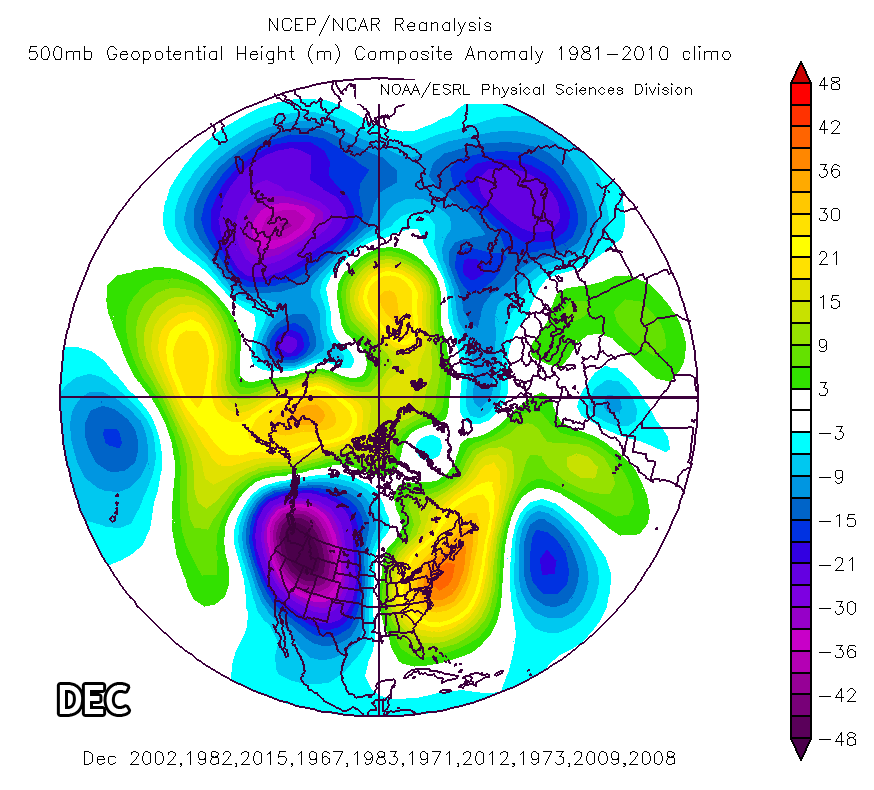
Many years feature a tornado shut down in December, but we only need to revisit December 2015 to know that’s not always the case. In similar fashion to January, highly amplified patterns can develop and waves of storminess can spawn tornado activity. Given that truly warm air is often hard to come by, the tornado threat generally focuses in locales near the Gulf.
Year, tornado total: 2002, 97; 1982, 96; 2015, 83; 1967, 61; 1983, 58; 1971, 56; 2012, 53; 1973, 49; 2009, 48; 2008, 46
Latest posts by Ian Livingston (see all)
- Top tornado videos of 2023 - January 1, 2024
- March 31, 2023 tornado outbreak videos - March 31, 2023
- Top tornado videos of 2022 - December 31, 2022
Well done tutorial on how the machine works Ian. Is there a seasonal meta-pattern and if so, what is the maximum forecasting window? I forecast your readers eagerly await your call for the plains this May.