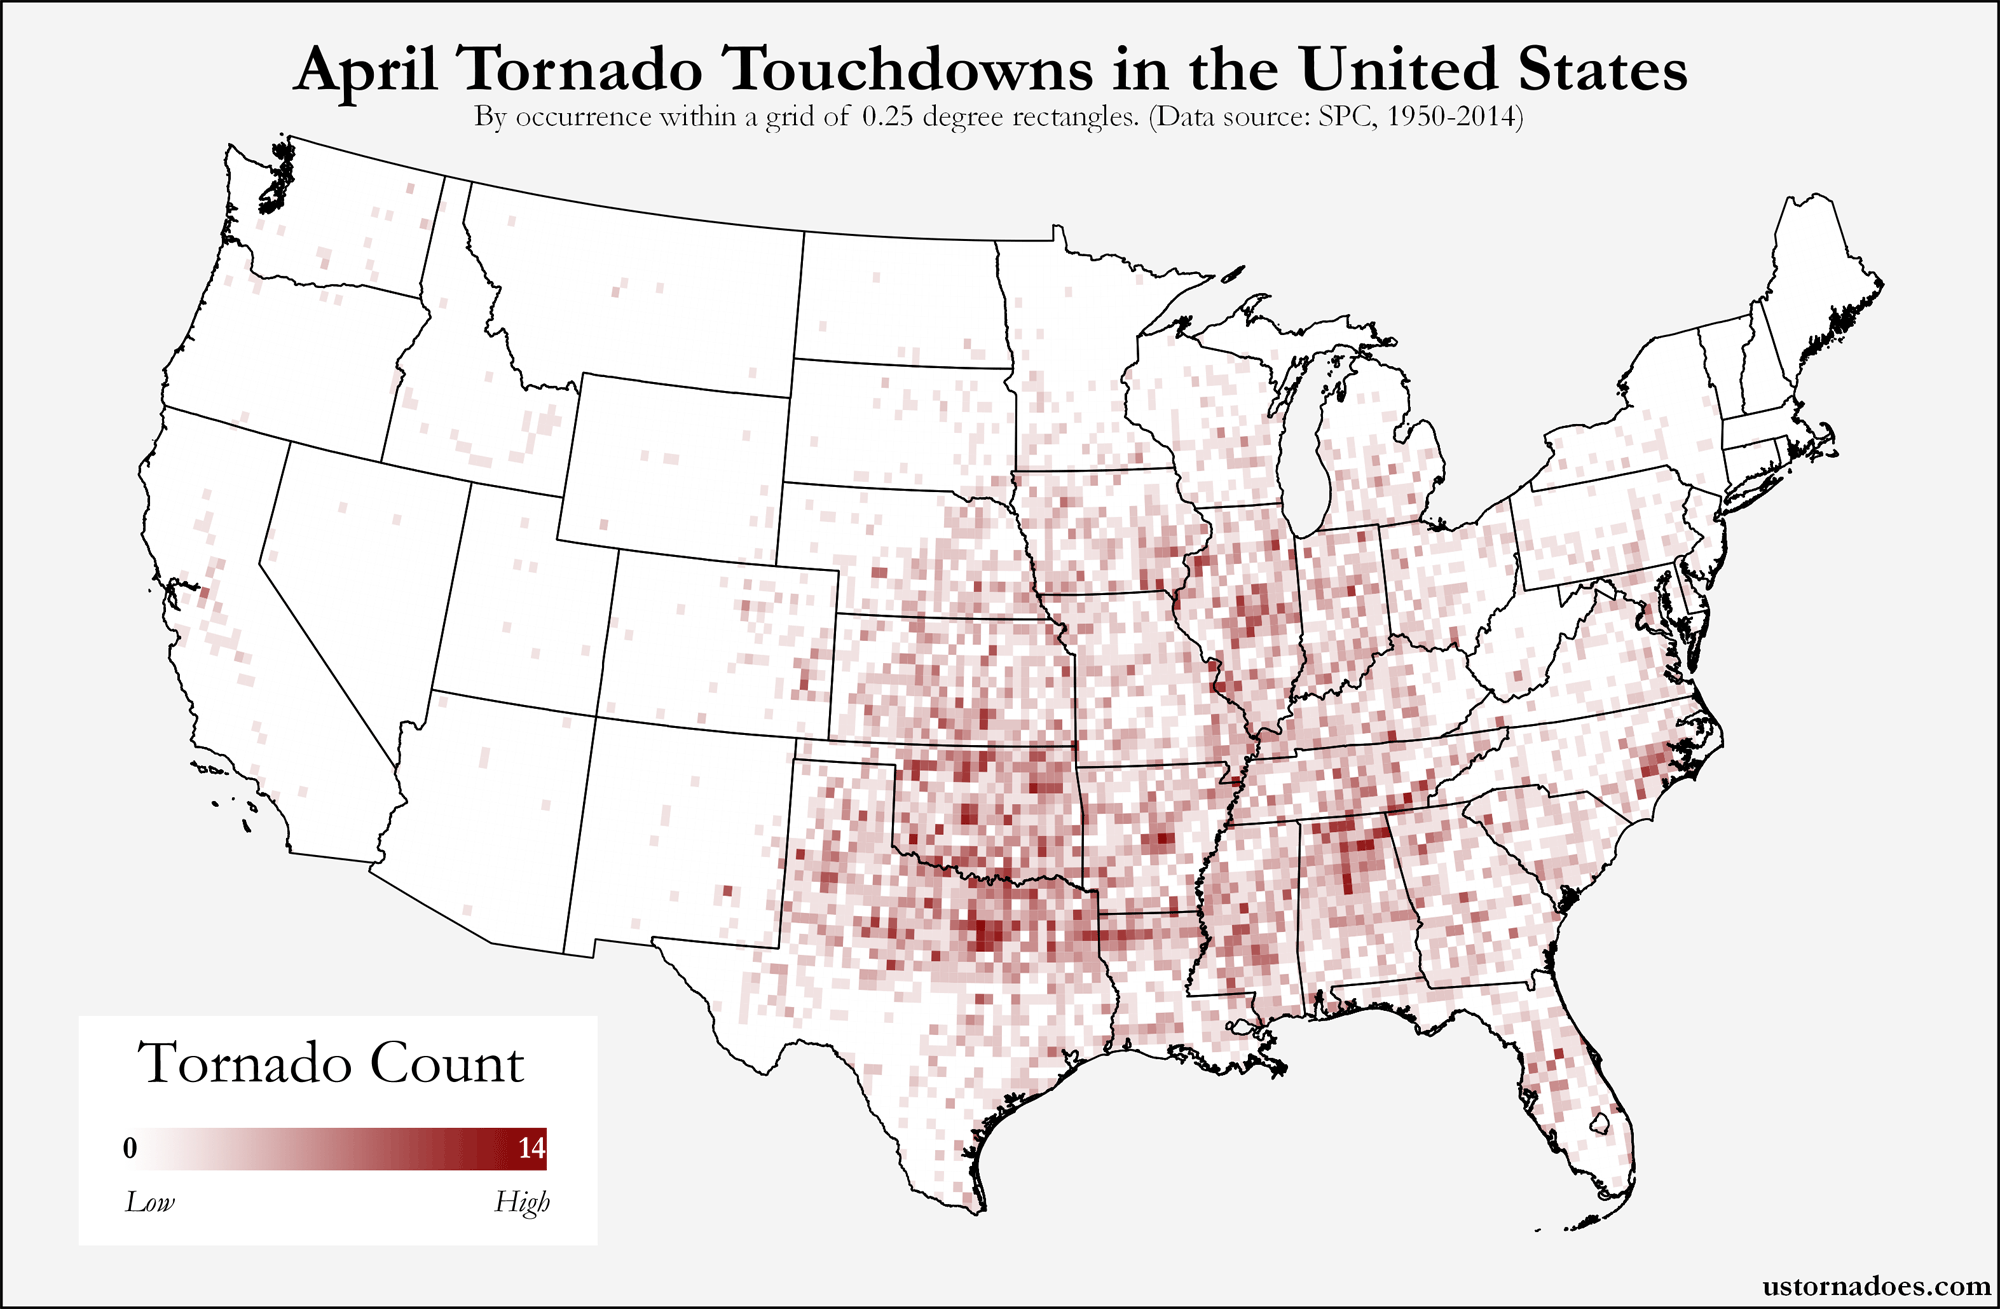
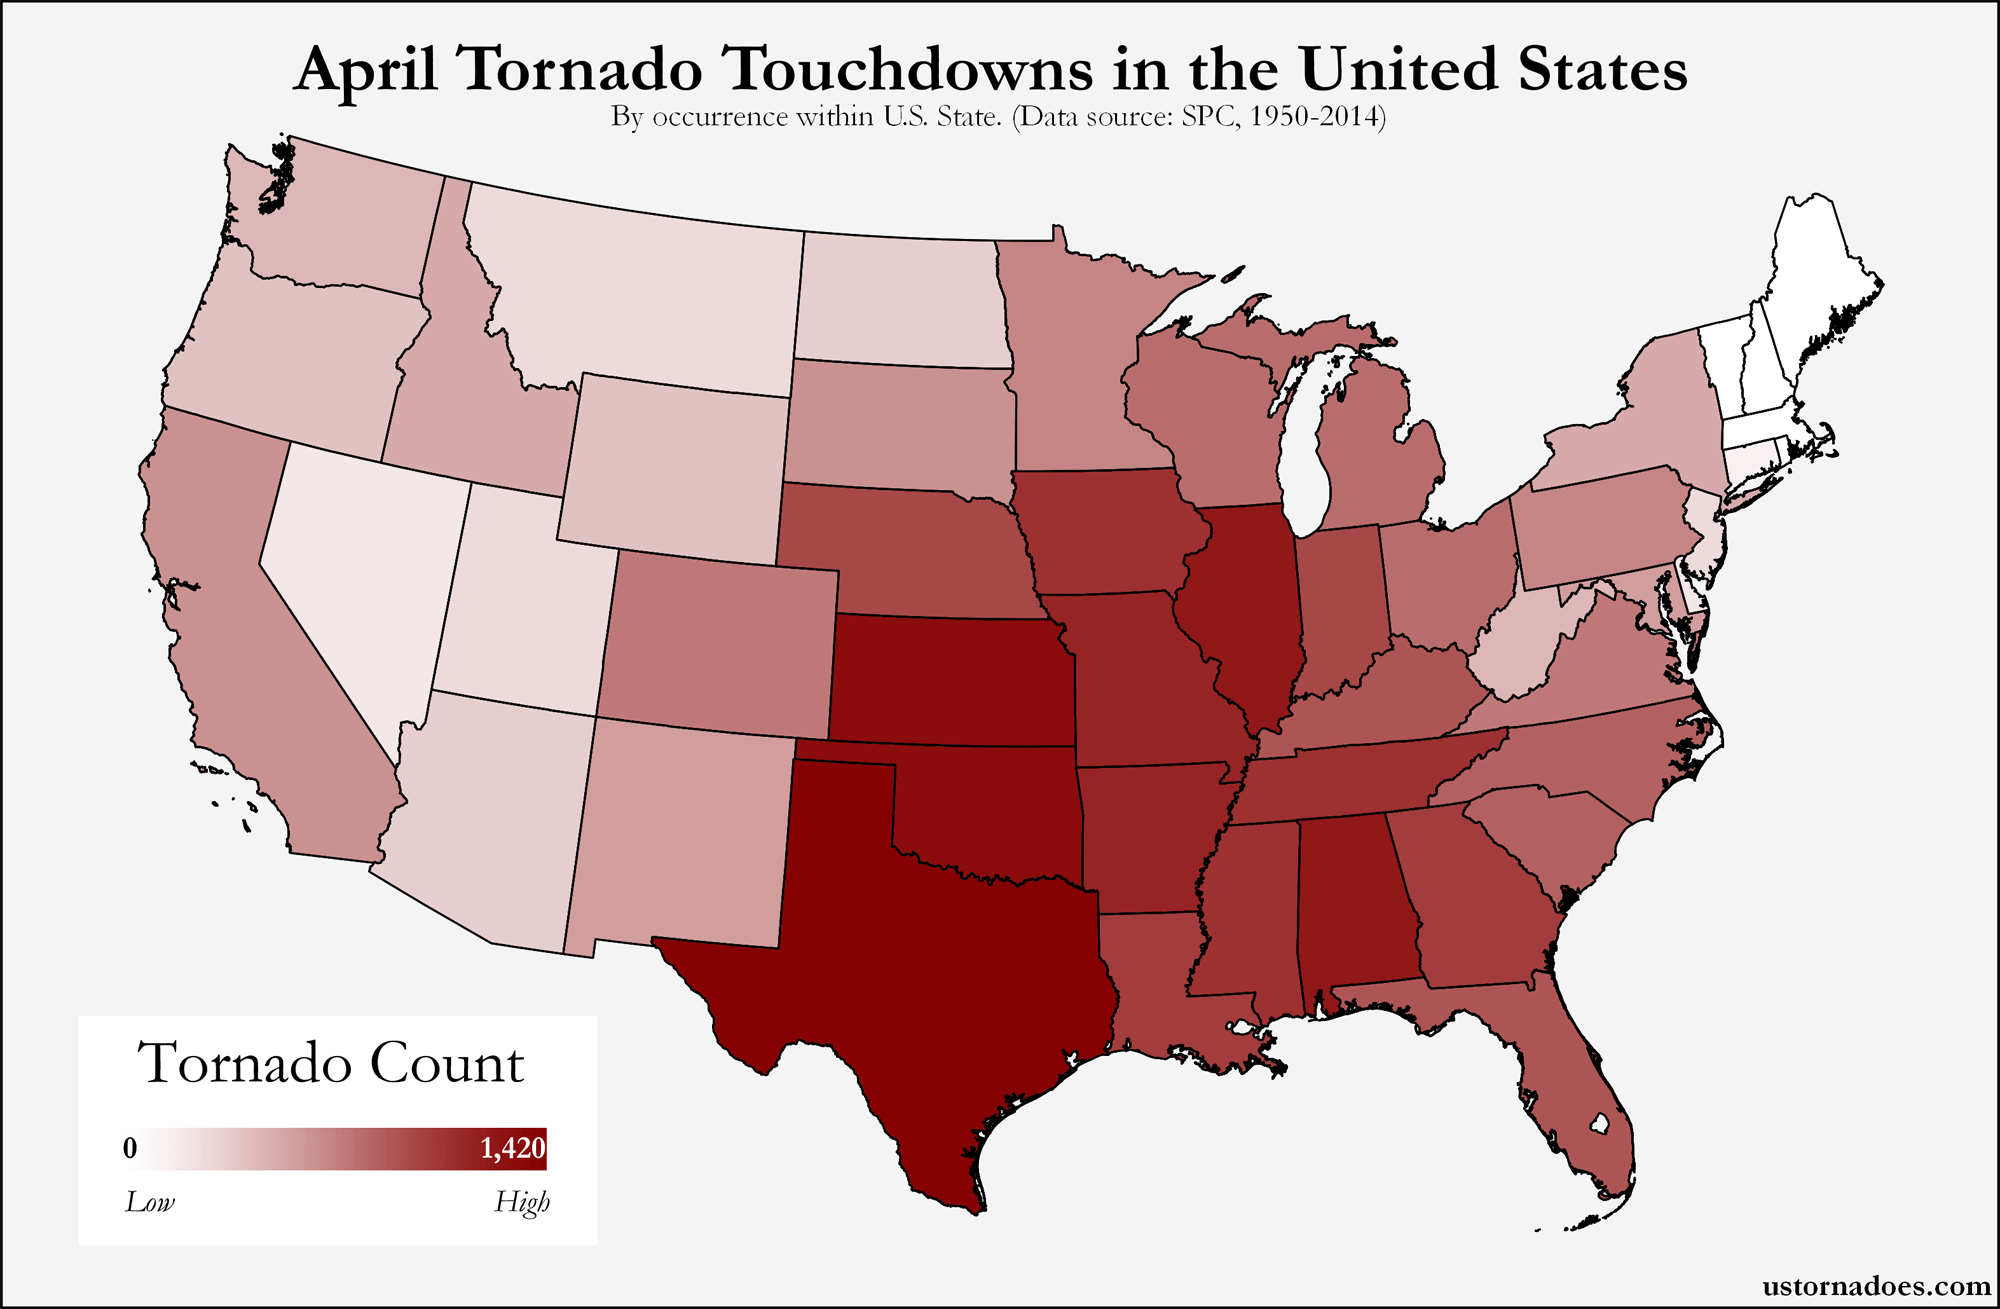
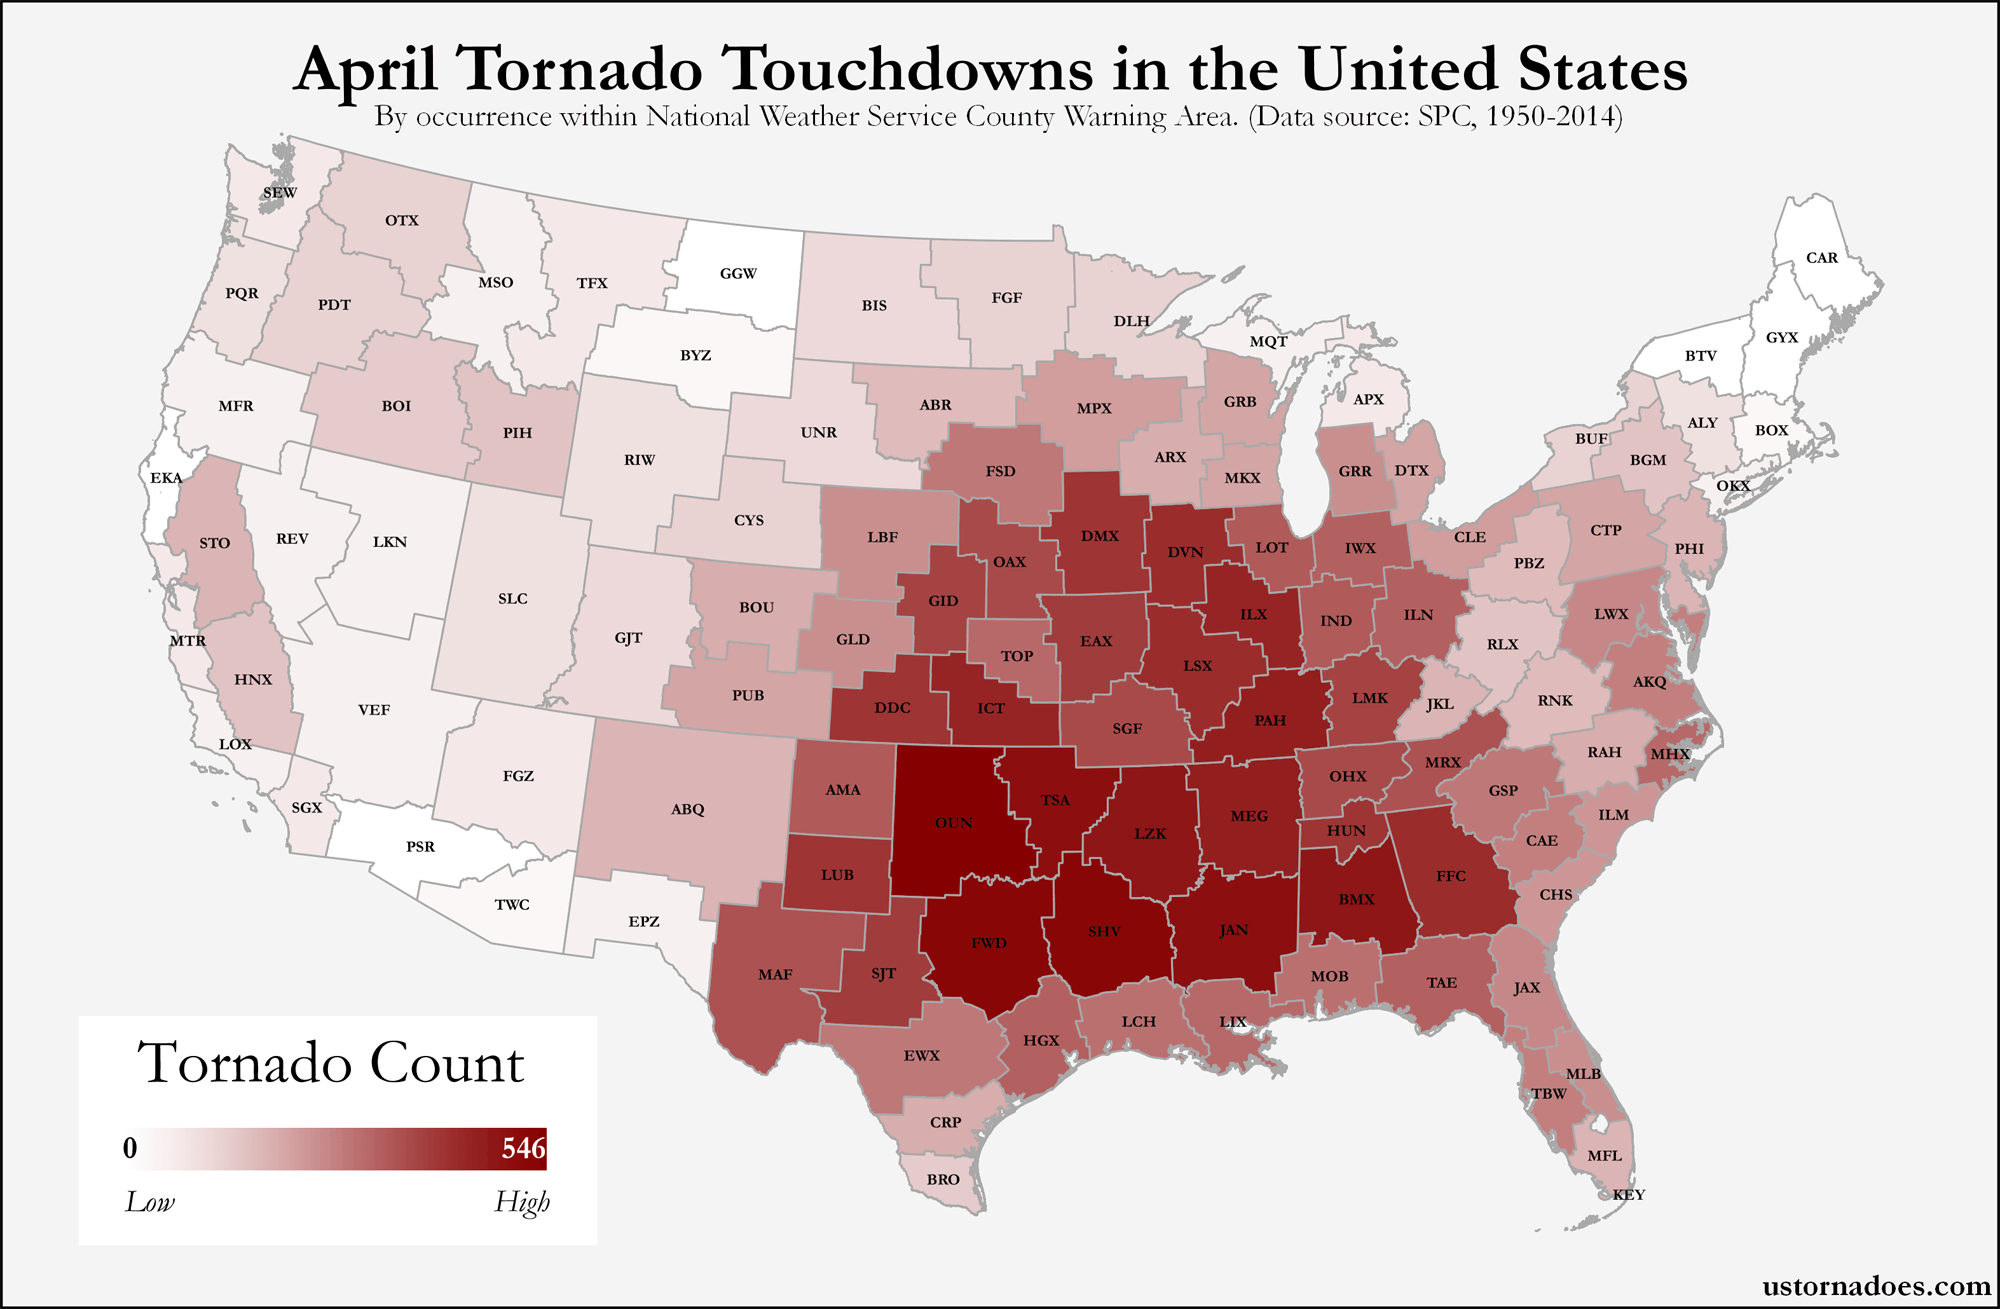
These maps break down April tornadoes based on where they begin.
Cumulative monthly tornado counts (since 1950) more than double moving from March to April. It’s the classical beginning of the three-month peak of the year.
Once we get into April, the migration of tornado zones away from the cold-season home near the Gulf of Mexico is increasingly apparent.The month is known as one with eyes on big-city targets from the southern Plains to the Southeast and up into the Midwest and lower lakes.
Where tornadoes form: January, February, March, April, May, June, July, August, September, October, November, December
Depending on the averaging period and length, April typically delivers about 150 to 170 tornadoes across the country.
The month is well known for extremely violent and devastating tornado episodes, partly due to dynamic early-season jet stream configurations and also because the month tends to focus its fury on more densely populated areas compared to May and June.
Across the contiguous U.S., only five states plus D.C. have not seen any tornadoes in April during the modern record dating to 1950. They’re all New England States. If you’ve ever been in New England in early spring, you probably know why. (hint: backdoor cold fronts and chilly oceanic air don’t tend to favor tornadoes).
Texas runs away with the month because it’s well-placed and gigantic. It’s not really a fair game there. Surrounding Texas, we see high tornado activity roughly in a polygon from there to Kansas into Illinois, then back down toward Alabama and back into the mid-South and southern Plains states.
The top eight states (yeah, expanding a bit for peak season — see end for data) for tornado touchdowns in April are: Texas (1,420); Oklahoma (753); Kansas (530); Illinois (490); Alabama (444); Missouri (407); Arkansas (399); Mississippi (370).
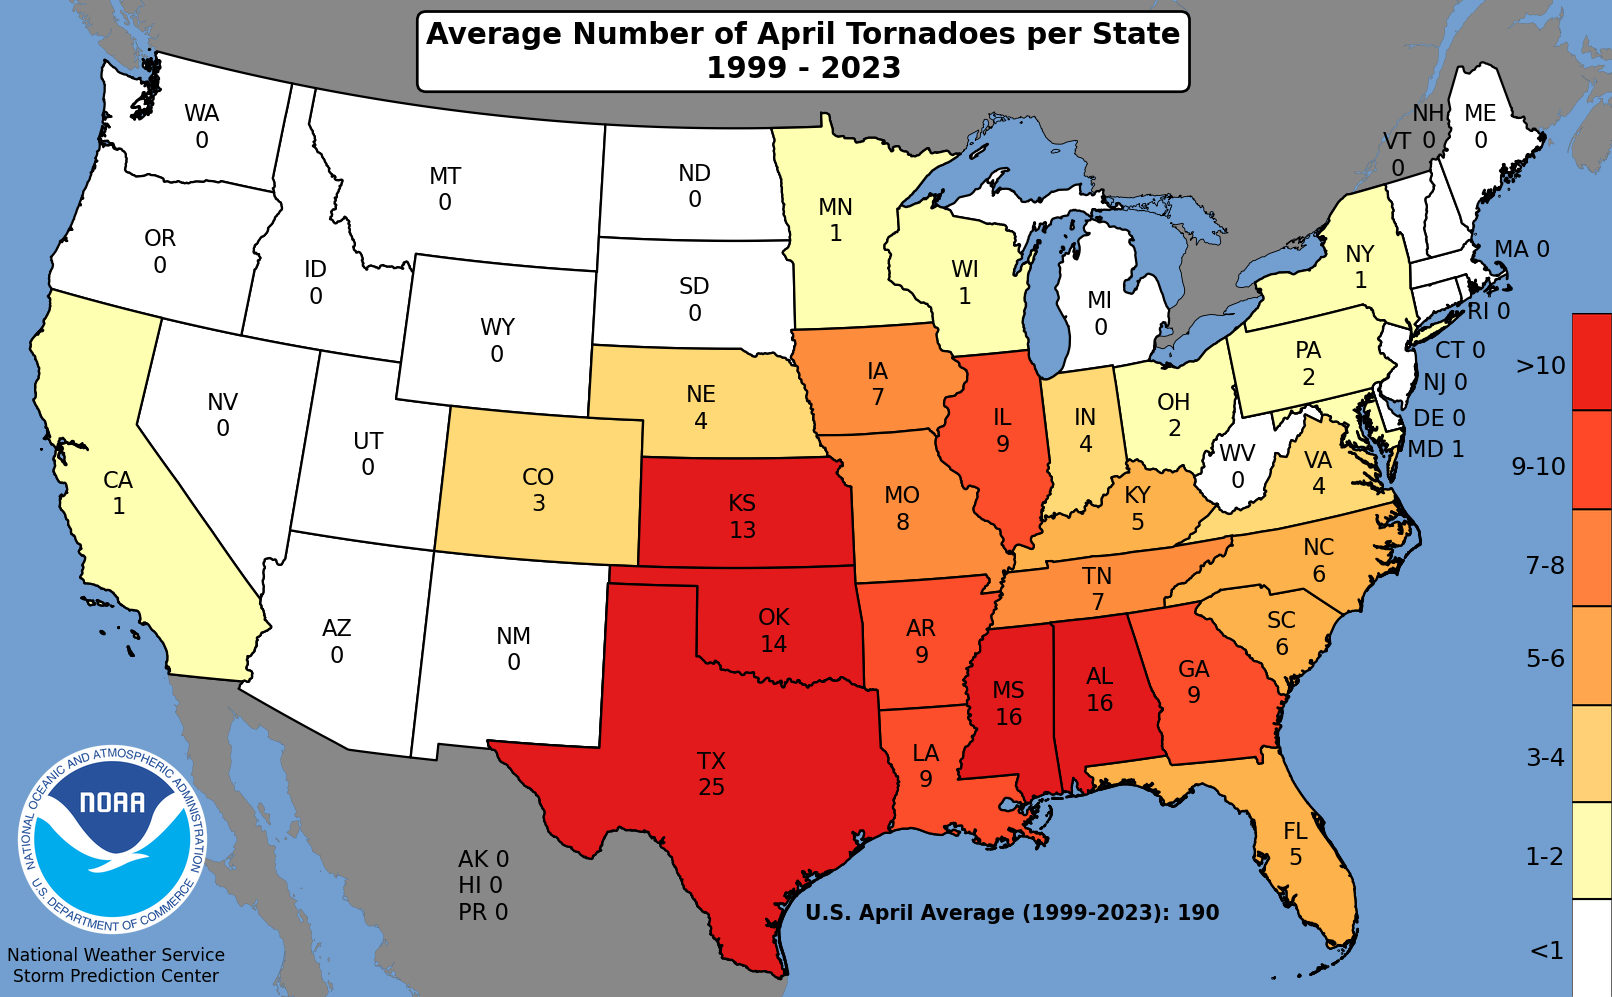
Related: April tornado averages by state (SPC)
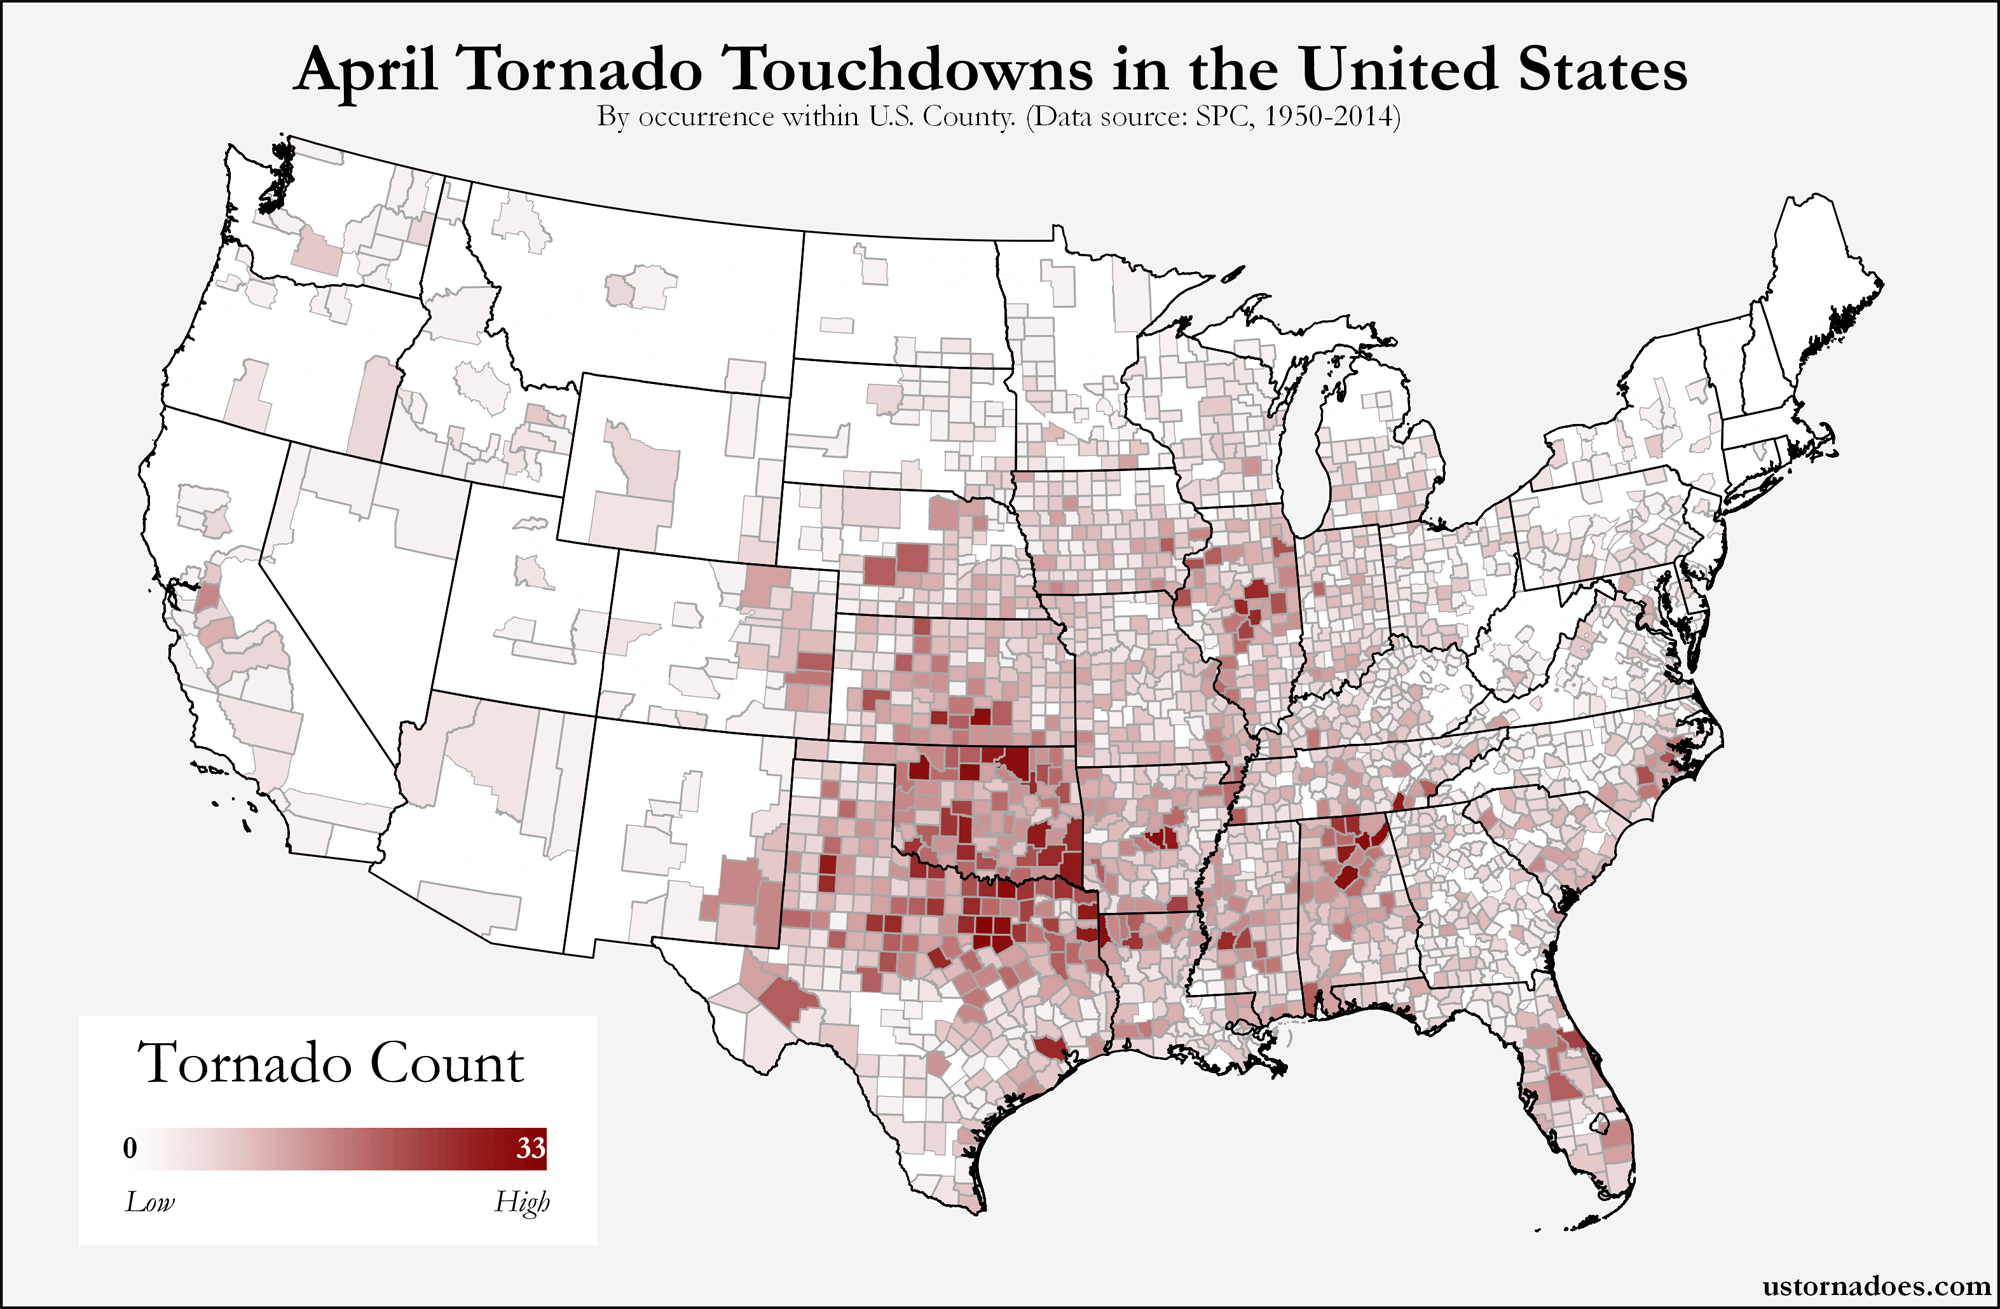
The county map lights up a large portion of the country compared to even just a month prior. It also shows a number of hotspots.
Perhaps the most pronounced area is across the southern Plains from Texas into Oklahoma. There are some gaps in there, but mostly a lot of darker red. Other pockets of enhanced touchdown activity lie across Alabama and Illinois in particular. There are also noticeable blotches elsewhere.
It’s the same general pattern seen above in the grid. The grid captures things on a smaller and more even scale. At least in the long-term record, it appears there is some population bias, as you can almost see the cities in certain regions based on where the dark colors are. This bias is much less in play today, or even non existent thanks to increased storm chasing and storm spotting.
The top eight (including ties) counties and parishes are as follows: Johnson, Tx. (33); Tarrant, Tx. (29); Woodward, Okla. (28); Garfield, Okla. (27); Jefferson, Al. (26); Caddo, La. (25); Pulaski, Ar. (25); DeKalb, Al. (22); Osage, Okla. (22); Marshall, Al. (22).
Related: The month of April by the numbers | Significant tornadoes in April
NWS Jackson is finally unseated after a five-month reign at the top of the list of NWS county warning areas seeing tornado touchdowns since 1950. It doesn’t fall far, but there is a clear shift westward and northward overall, as seen in the other maps here.
An area of deeper NWS office tornado touchdown frequency can be noted running from the southern Plains and into the mid-South, through parts of the southeast. Considerable tornado activity has occurred into the central Plains and Midwest offices as well. Other locally enhanced zones like those in central California and parts of the Mid-Atlantic can also be seen.
The top eight NWS offices for tornado touchdowns in April are: Norman, Okla. – OUN (546); Fort Worth, Tx. – FWD (466); Shreveport, La. (378); Jackson, Miss. – JAN (323); Tulsa, Ok. – TSA (288); Birmingham, Al. – BMX (241); Little Rock, Ar. – LZK (231); Memphis, Tenn. – MEG (206).
Data (1950-2014): States | Counties | NWS (.csv files)
It's peak tornado season. We briefly examine the top outbreaks from April-June.
A dip in the jet stream is blasting toward the central United States and poised…
A historic storm system swept through the central, southern and eastern U.S. from Friday through…
In a field historically dominated by men, Jen Walton has emerged as a transformative figure…
Jason Persoff, MD, SFHM, is recognized globally for his expertise in storm chasing. He earned…
Tornado numbers were near or above average. A chase season peak in June provided numerous…