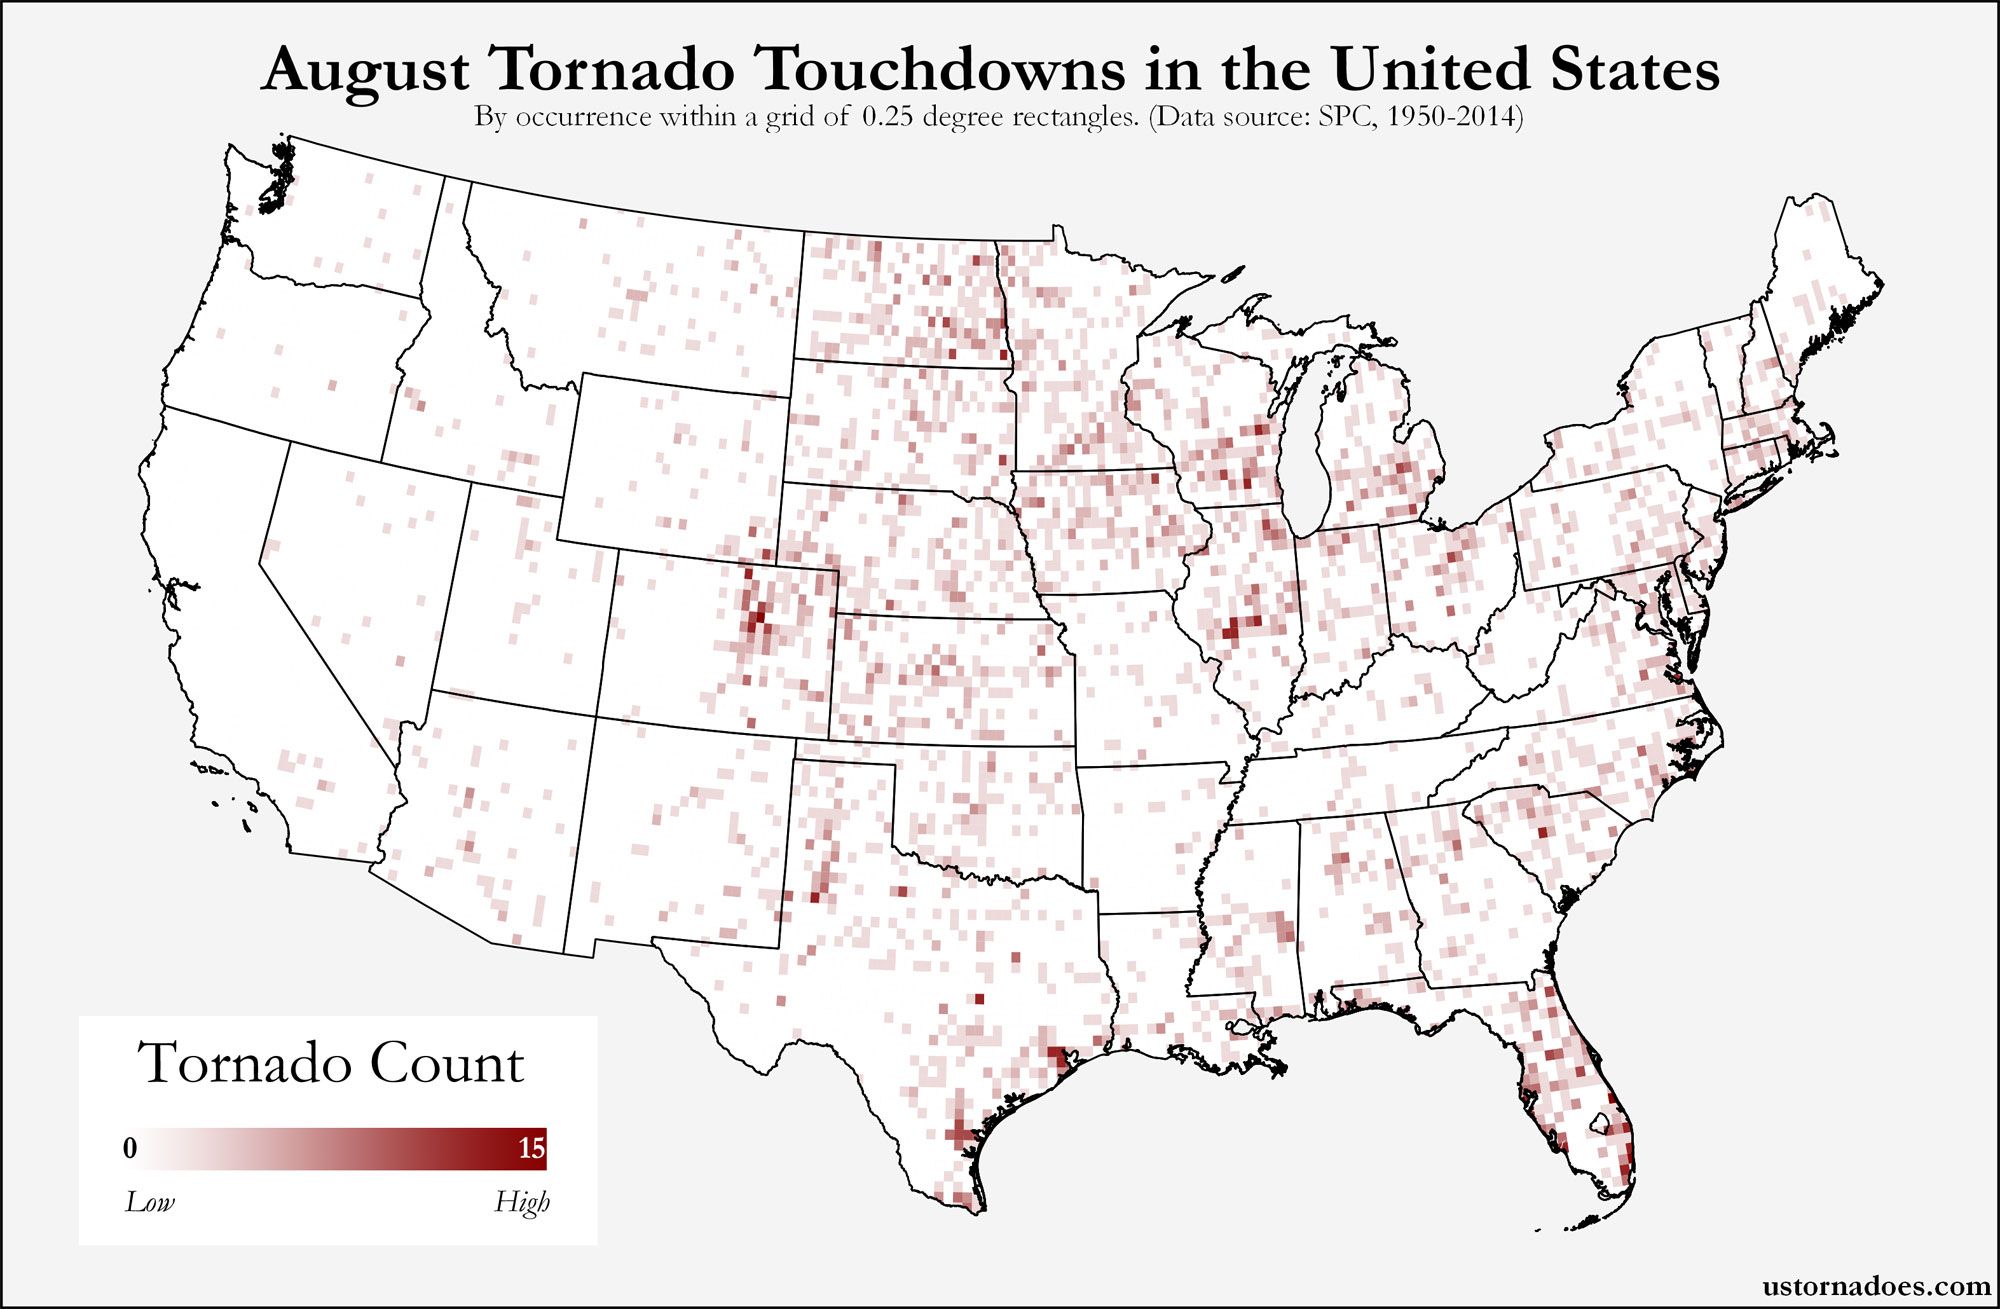
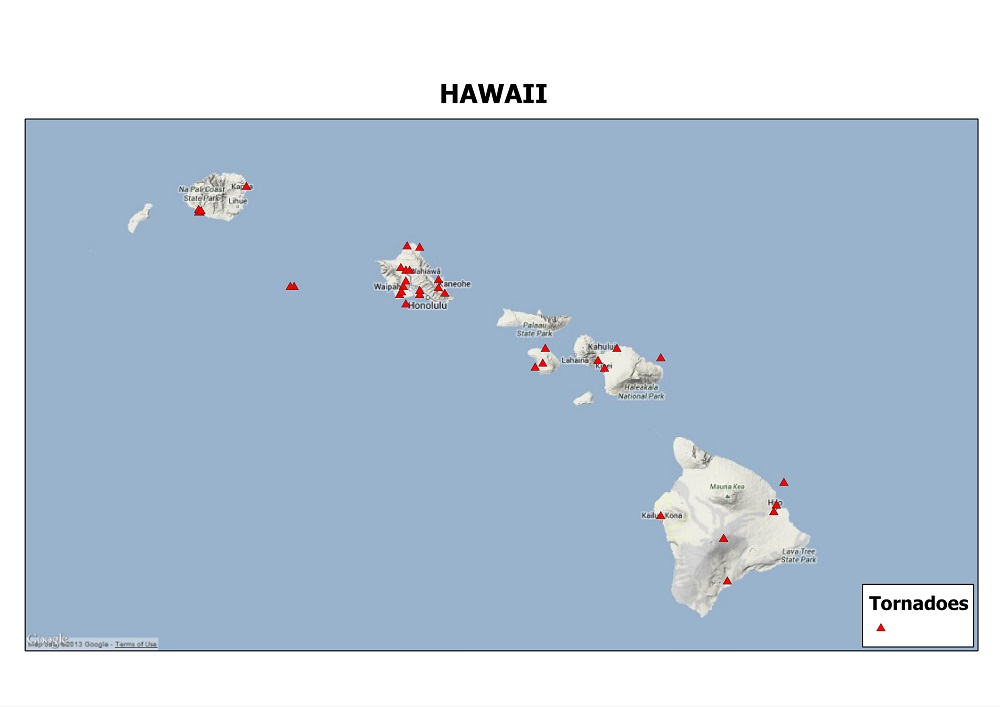
These maps break down August tornadoes based on where they begin.
By the time we hit August, there’s no denying that the peak of the tornado year is getting further and further behind us. However, August does rank higher than the six months that follow it when it comes to averages and overall numbers.
It’s actually quite a bit like July except that numbers are lower overall. The northern tier of the U.S. remains the focus of organized activity for the most part. We also often see heightened activity across parts of Florida, and Texas returns to the game after being knocked back a bit in July.
Where tornadoes form: January, February, March, April, May, June, July, August, September, October, November, December
The average for August tornadoes is right around 80. This is a continuation of the decline that happens coming out of spring and early summer.
That trend will keep happening into and through the cold season, with the possible exception of a “second season” bump in October or November. Even with that bump, the numbers are generally lower than in August despite the fact that there might be a better chance of an outbreak again during that time of year.
Much like July, one reason for the lower numbers in August is simply that the jet stream is often displaced well to the north, given that we’re still near the heart of summer in the United States. Storms are also a little less frequent across the country overall compared to July, so there are fewer of the “random” incidents of tornadic activity. That said, it is a warm and humid month for much of the nation, so tornadoes can happen just about anywhere.
The grid map up top and most of the maps below don’t necessarily show major patterns for August tornadoes. As with the rest of summer, the front range of Colorado tends to be a favored spot for tornado activity. As does parts of the northern Plains and upper Midwest. Florida and Texas are rather lit up on the maps as well. Texas, partly because it’s huge. Florida, partly due to air mass tornadoes and waterspouts moving ashore, plus increased offs of tropical storm activity as we get through the month.
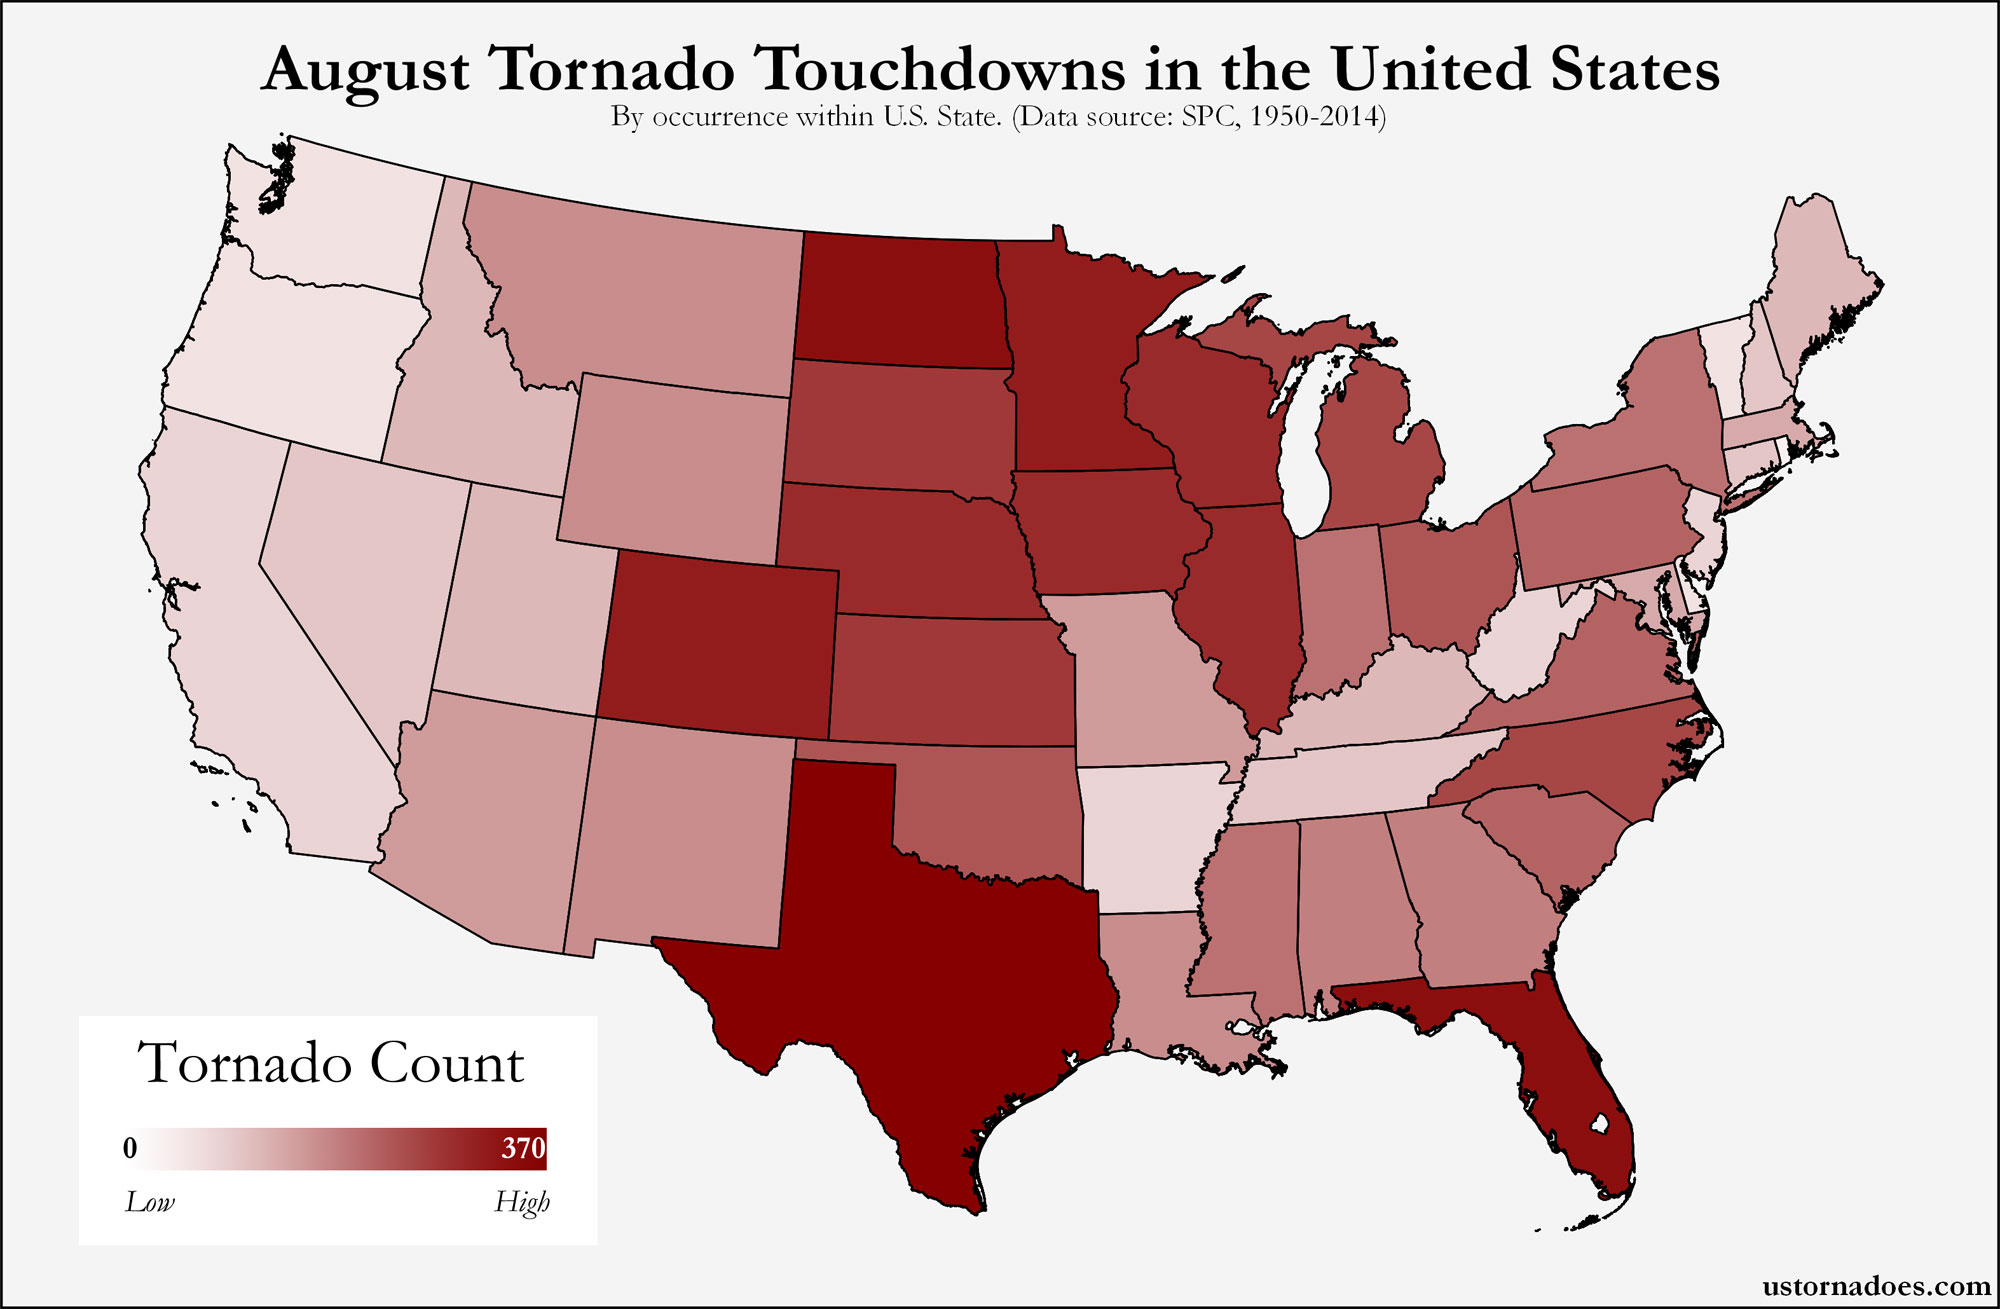
Only the District of Columbia has not seen a tornado touchdown in August across the contiguous United States.
Generally, August will tend to favor at least transient high pressure pushing through the upper South and toward the mid-Atlantic, which helps stymie tornado activity in places that typically see plenty like Tennessee, Arkansas, and Kentucky as well as immediate surrounds.
These states lead the way for tornado touchdowns in August: Texas (370); Florida (298); North Dakota (235); Colorado (201); Minnesota (192).
Related: August tornado averages by state (SPC)
As noted up top, the area of focus on a smaller scale — such as counties below — is actually fairly similar to July. The Front range, arcing up into the northern Plains, then across parts of the upper Midwest are prime zones. The desert southwest continues to be lit up a bit as monsoon persists in that region as well. There’s also maybe a hint of cold fronts beginning to progress further south and east in the Plains as well with the approach of fall.
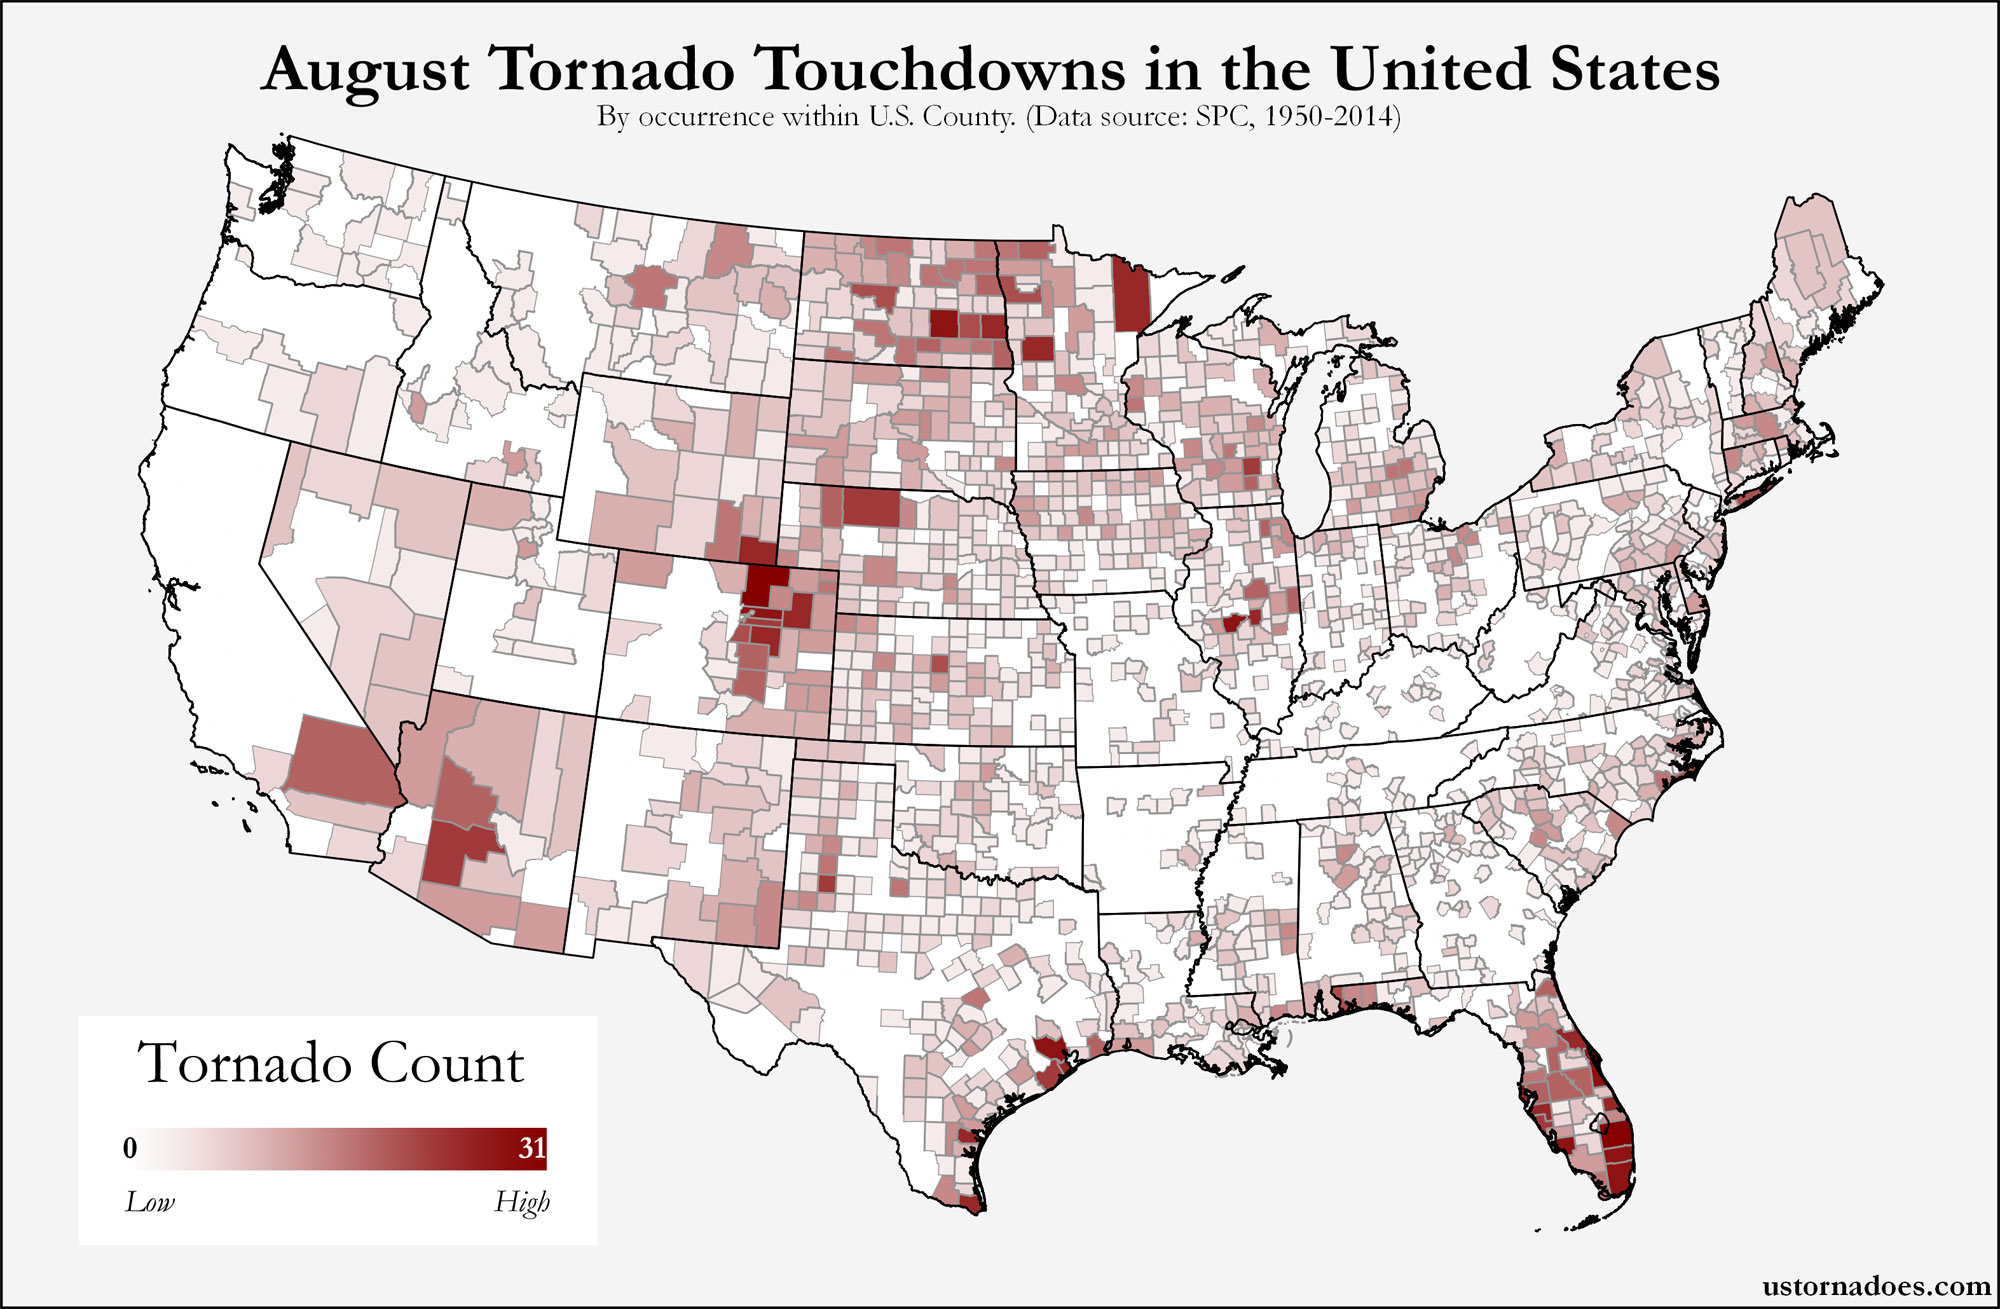
While often not in the news due to short duration and way more than often weakness, Florida remains a hotspot for tornadoes, as with July. The state sees frequent air mass storm type tornadoes that are often very short lived. There is also increased likelihood of tropical system induced tornadoes as we head toward peak hurricane season.
These counties have seen the most tornado touchdowns in August: Weld, CO (31); Palm Beach, FL (25); Harris, TX (23); Sangamon, IL (22); Brevard, FL (21).
Related: The month of August by the numbers | Significant tornadoes in August
For the second month in a row, Grand Forks, ND leads the list when it comes to tornado touchdowns within NWS office boundary areas.
June, July and August all tend to favor offices well on the way to Canada. Otherwise, the map shows some of the detail the finer maps above do. There’s a paritcularly large splotch of red across the northern Plains and upper Midwest. South Florida is notably red as well.
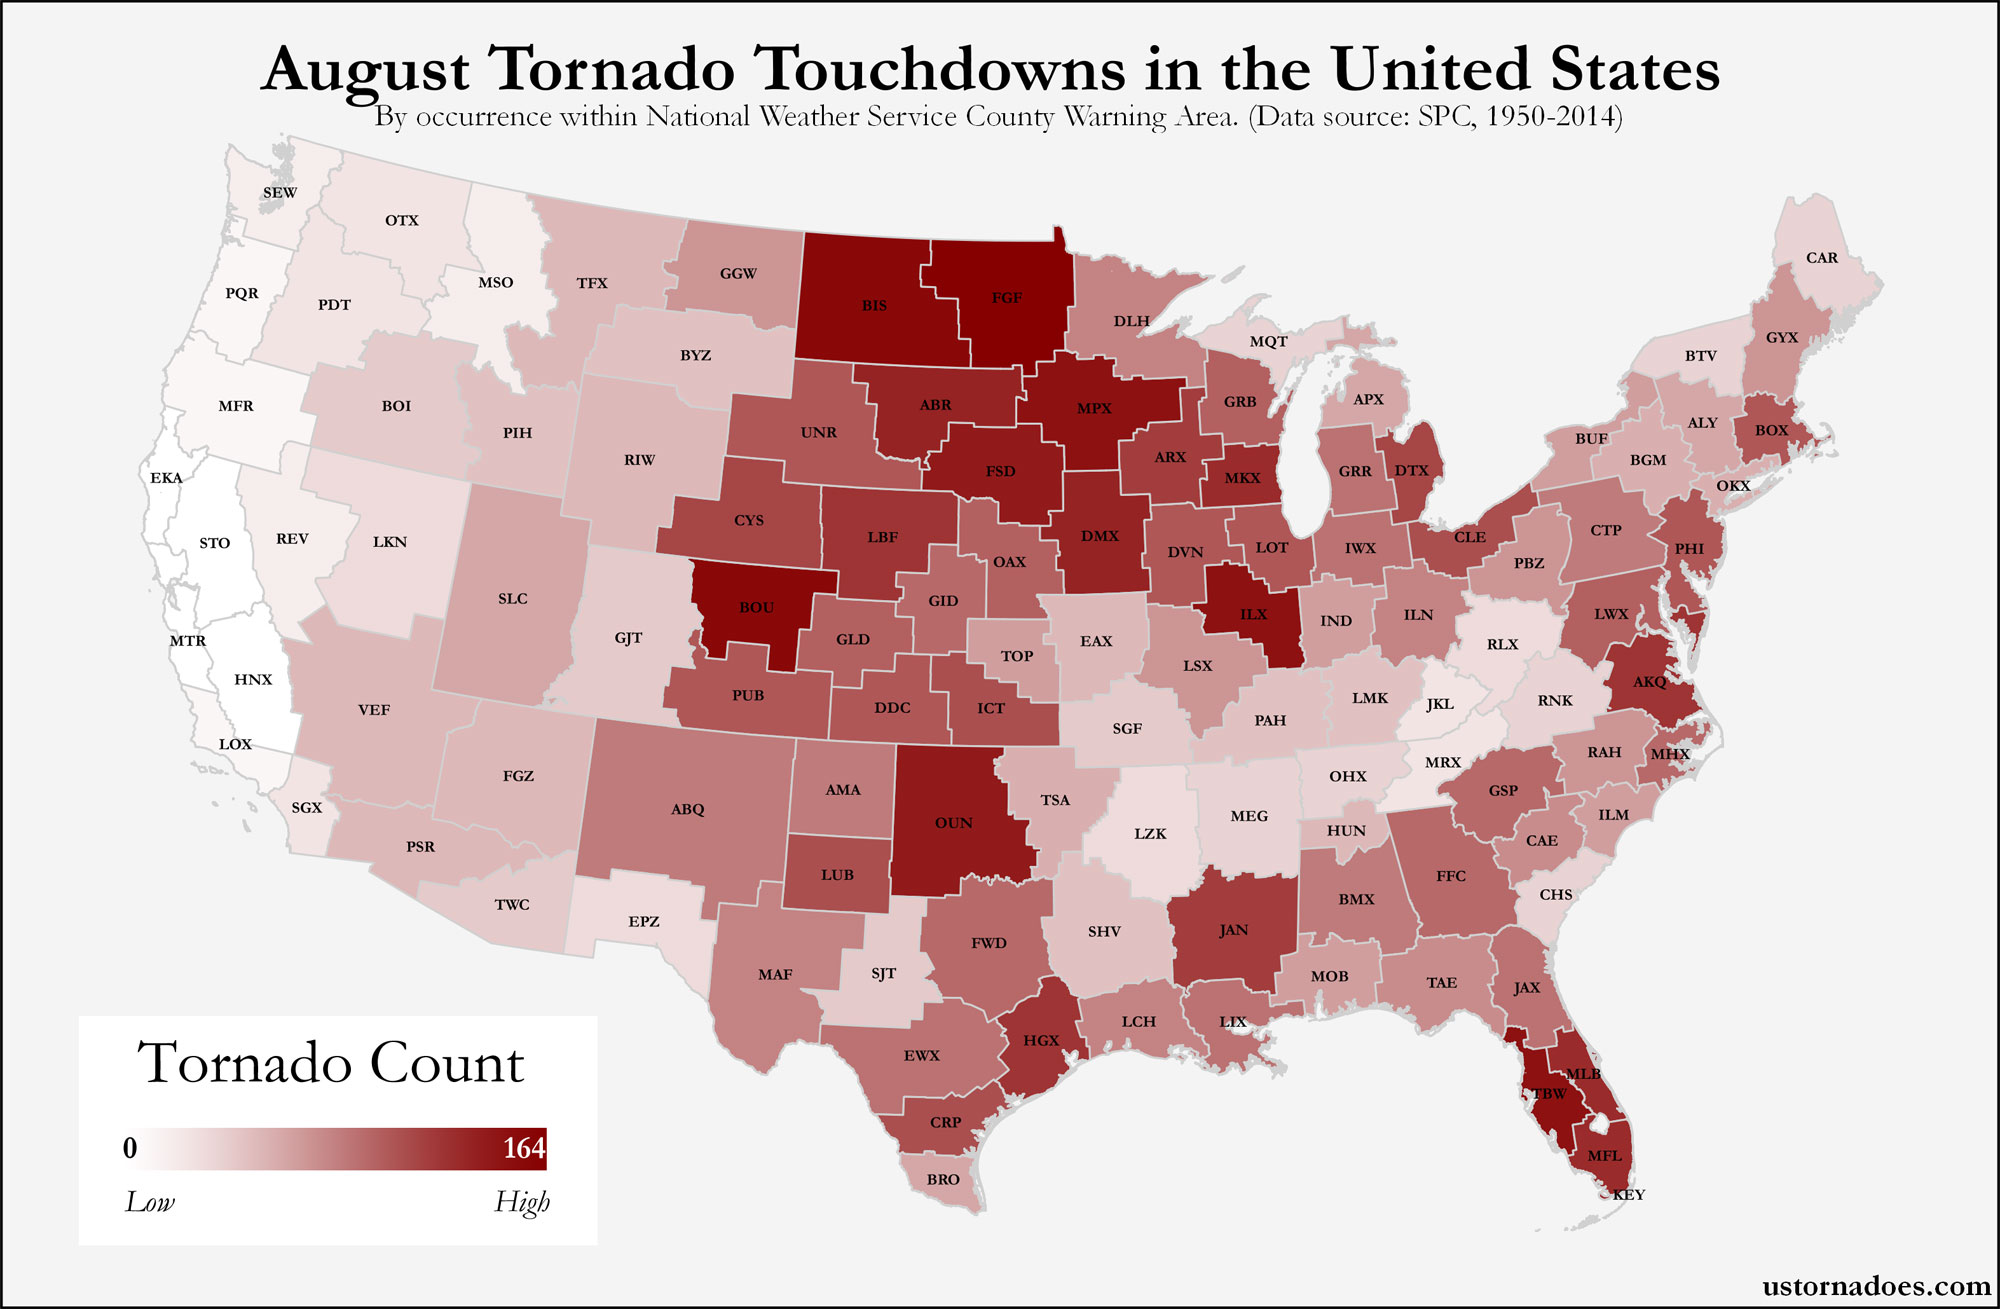
These NWS offices that have dealt with the most touchdowns: Grand Forks, ND – FGF (164); Bismarck, ND – BIS (140); Boulder, CO – BOU (133); Twin Cities, MN – MPX (106); Tampa Bay, FL – TBW (95).
Data (1950-2014): States | Counties | NWS (.csv files)
Latest posts by Ian Livingston (see all)
- Tornado outbreaks: April, May and June peak-season primer - April 27, 2025
- Busy March for twisters to end with another multi-day event - March 28, 2025
- Everything but locusts: NWS shines in apocalyptic weather - March 17, 2025