In the United States, tornadoes are rated on a zero to five scale, with zero being the least intense and five being close to unfathomable in its destruction.
Using today’s Enhanced Fujita Scale, EF0 and EF1 tornadoes are typically considered weak. EF2 and EF3 tornadoes are considered strong, and sometimes intense when it comes to the latter. EF4 and EF5 tornadoes are thought of as violent. Prior to Feb. 2007, the Fujita Scale was used, so EF was F, in addition to some other stuff.
Tornadoes by state
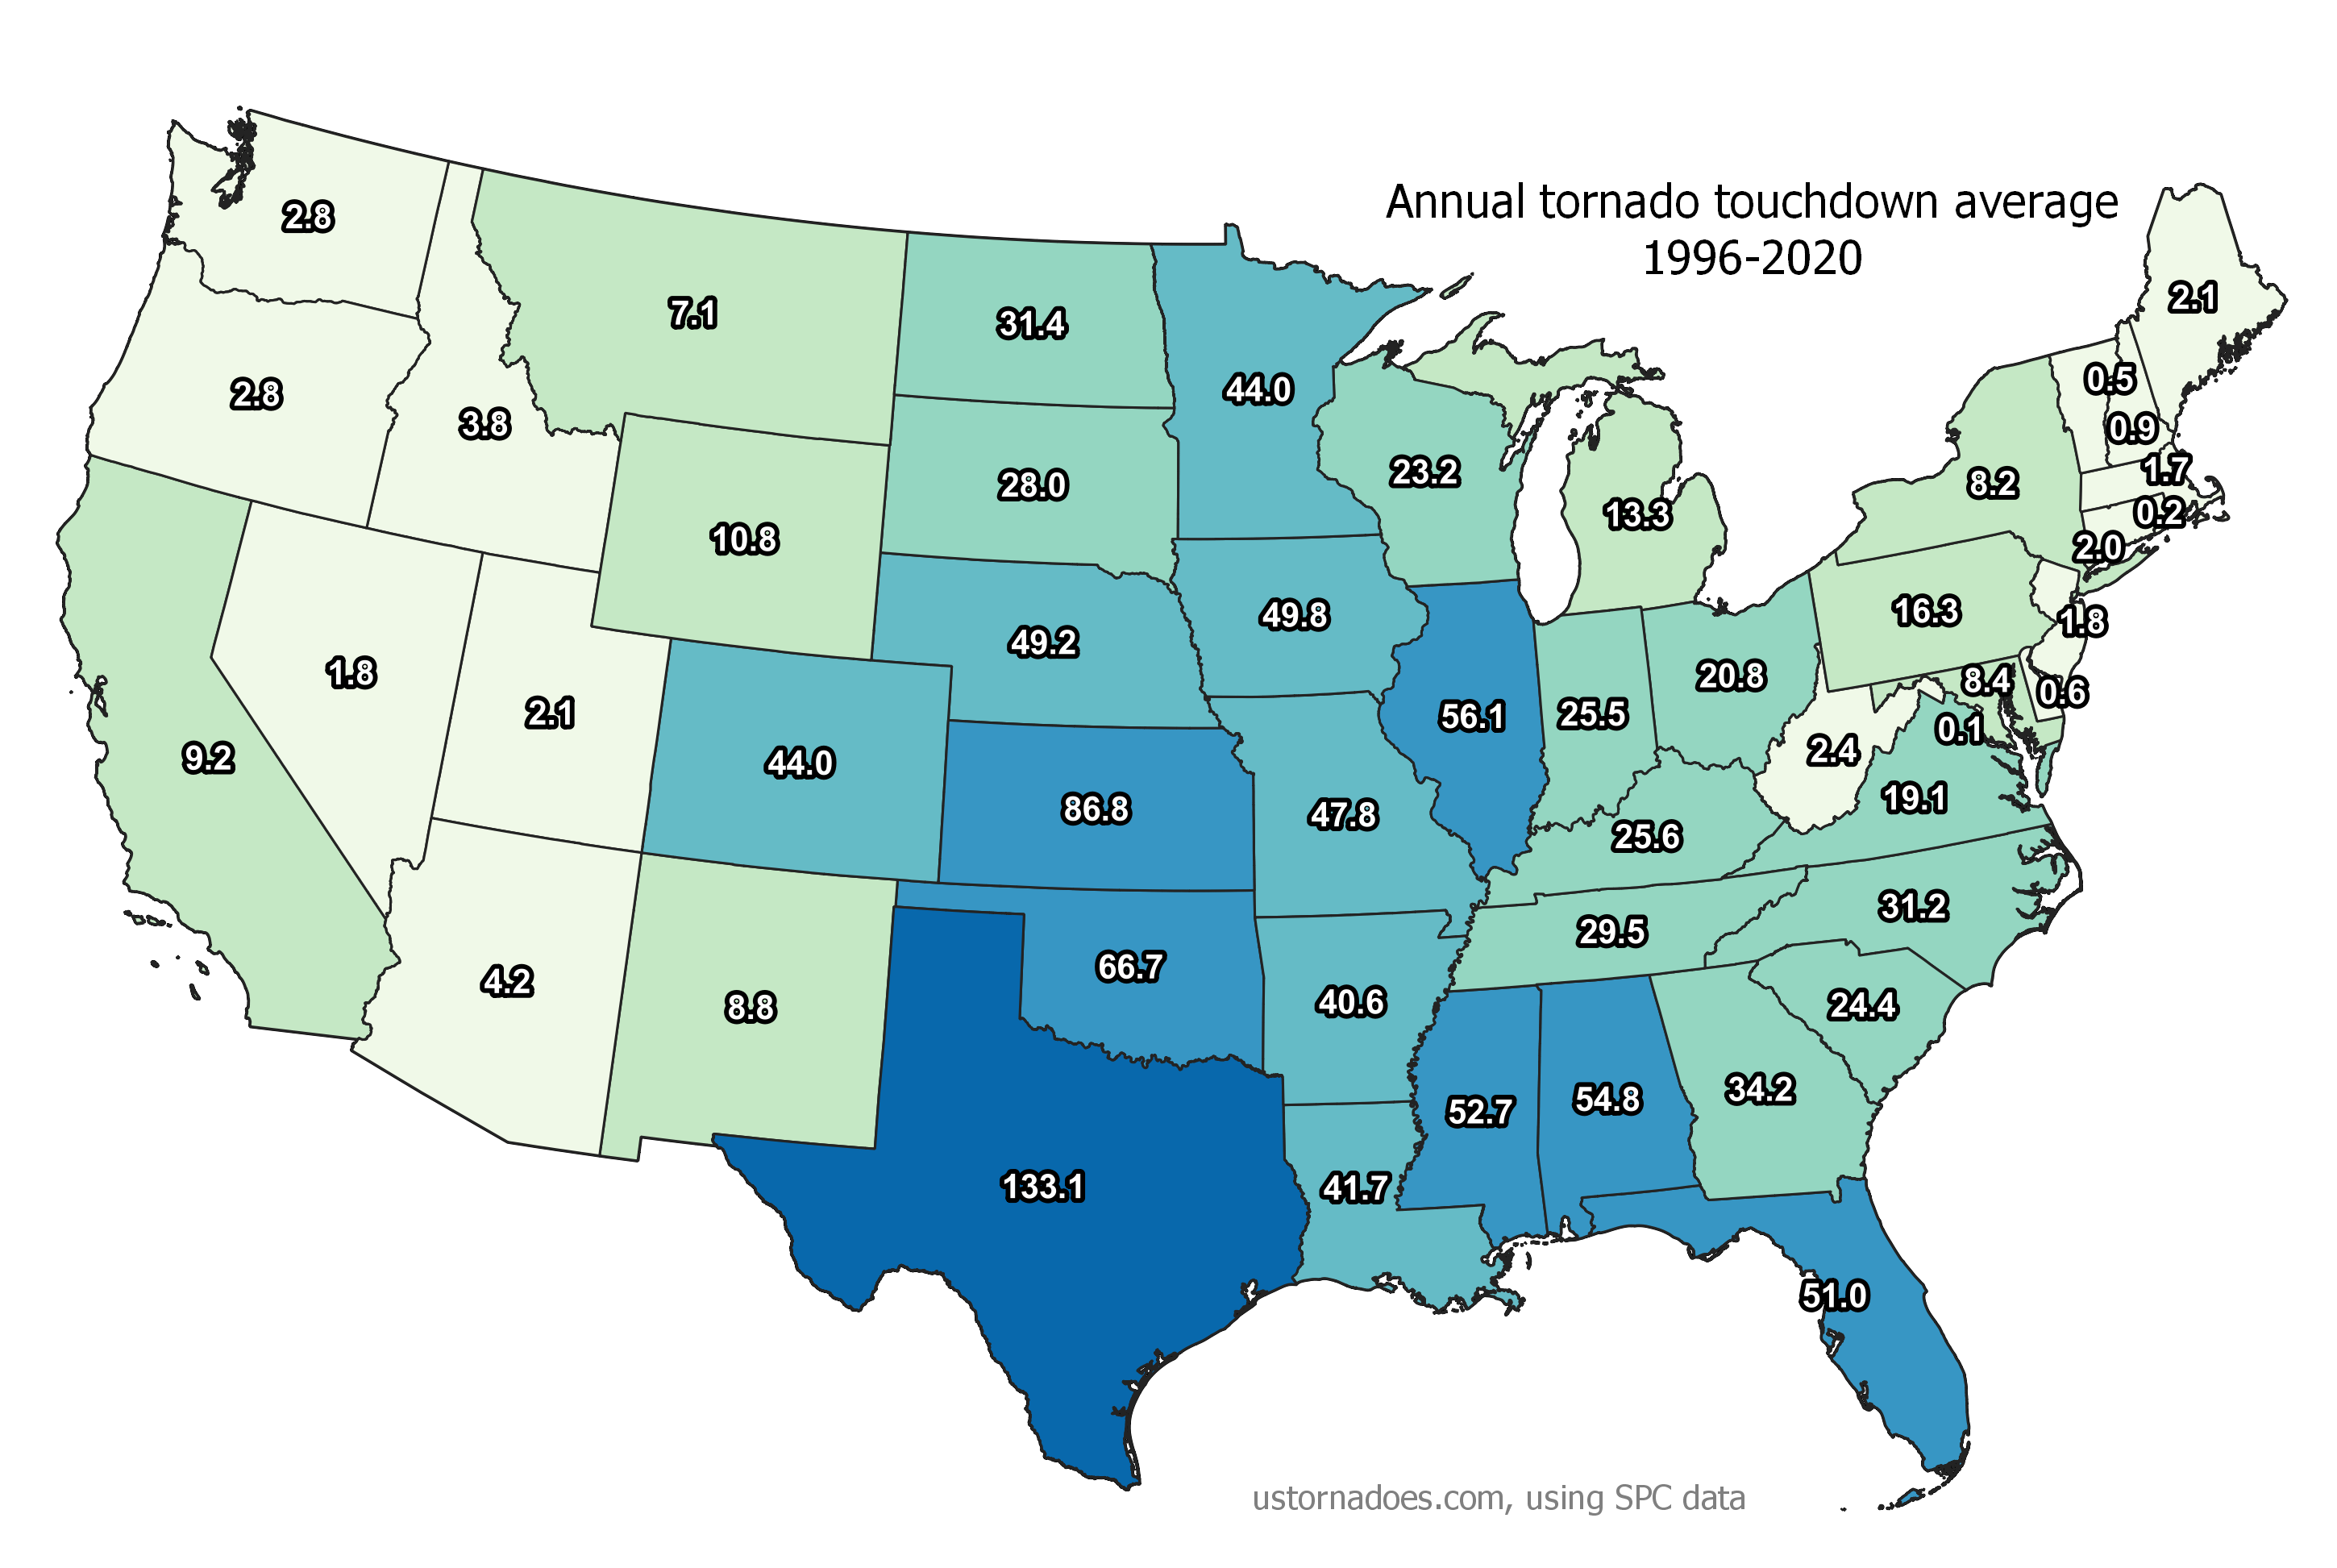
Texas, in part thanks to being huge, is the leader when it comes to average annual tornadoes over the 1996-2020 period, with 133. The next tier of states, ranging from 50 to 87 tornadoes annually, includes Kansas, Oklahoma, Illinois, Alabama, Mississippi, and Florida.
Tornadoes by month (1996-2020 average)
“Tornado season” is both a misnomer and a relatively accurate framing of the situation. Although tornadoes can and do happen across the year, the vast majority occur during spring and early summer. If extending the core season from March through July, the period sees 69 percent of tornadoes on average. Months that currently have an average over 100 tornadoes are April (191), May (273), June (200), and July (109).
The 1996-2020 average is 1,233 tornadoes per year.
Doppler-era tornadoes
The advent of Doppler radar has been critical in catching shy tornadoes. Its full adoption, technical advancements since, and increases in storm observation more broadly, have allowed for lots of quick-hitting or weak tornadoes that would have once been missed to now be found.
Pre-Doppler tornadoes
The increase in annual tornadoes predates full doppler adoption, but it is again largely tied to observational betterment. In the 1955-1994 period, the average was 813 tornadoes per year.
Doppler-era strong tornadoes
Strong tornadoes are those rated F/EF2 or greater. We might expect 131 strong tornadoes per year, based on the 1996-2020 average. In the entire modern record, strong tornadoes make up 19 percent of twisters, and 96 percent of fatalities.
Pre-Doppler strong tornadoes
When it comes to strong tornadoes, 2011 is the leader since the mid-1990s, with 279. Interestingly enough, there are seven years in the modern record prior that have more than 300 strong tornadoes. 1973 holds the overall record, with 386 strong tornadoes. Rating metrics have changed over time, making it hard to compare those numbers to present day.
Total tornadoes, 1950-2020
Across all of history, weak F/EF0 and F/EF1 tornadoes have comprised about 80 percent of all twisters. F/EF2 make up about 14 percent, F/EF3 roughly four percent, F/EF4 nearly one percent, and F/EF5 a miniscule 0.1 percent. As we saw in an examination of violent tornadoes, 63 percent of all fatalities have been caused by that one percent of F/EF4 and F/EF5 events.
Statistics are based off the Storm Prediction Center tornado database. 2021 numbers are preliminary and thus not included in the averages noted even though they are included in the graphics. Preliminary 2022 numbers can be found at Wikipedia. This page is undergoing development, and last updated March 20, 2022.
Thank you for this information. I am moving to San Antonio, TX and they say there isn’t a tornado threat of much significance there. I have been trying to verify this. Can you help me know where, how often and what severity historically has been observed in the San Antonio and Austin areas of Texas? Are there any areas within that local area that have a higher propensity historically to have had tornados?
Awesome overview! I’m a retired engineer, now traveling a lot in our RV. We try to use this type of info to plan our trips. Got caught in a thunderstorm last night, golf ball sized hail punctured thru our skylights. Not sure if any tornados were in the area, but we heeded the national weather services warnings!
I wish someone would do an average of all tornadoes regarding their EF rating per year. My guess is that it would contradict the Global Warming narrative so nobody has done it.
I think that you are mistaken about what the “global warming narrative” is, though perhaps you would enlighten us on what you believe it to be. The evidence for anthropogenic climate change is very strong; the evidence that it makes for more EF4 or 5 tornadoes is not strong. Check out this article:
https://yaleclimateconnections.org/2021/07/climate-change-and-tornadoes-any-connection/
Please post the alleged evidence of manmade ‘global warming’. The sun heats the earth the most and it has cycles of being hotter and cooler relatively speaking. When the sun is hotter it makes the earth hotter. There’s a direct correlation. People within universities and government like Al Gore have become $billionaires have been caught altering data to make it appear that man is warming the earth so they can make money selling carbon credits. The internet has been wiped of the stories of this fraud. BTW, why do people like obama, al gore, pelosi all buy mansions on the ocean if they really believe the earth is warming.
What’s the source for this data? I’d like to cite it, but I know that alarmists will claim it’s not properly sourced.
The raw data for these charts can be downloaded into Excel from the Storm Prediction Center’s web site:
https://www.spc.noaa.gov/wcm/data/1950-2019_actual_tornadoes.csv
my friends said there’s a tornado coming but I don’t believe them