Forecast basics Identifying and understanding ingredients | Search for boundaries and gradients | Looking for what could go wrong :: Spotting basics Tornado shapes and sizes | Tornadic radar signatures
Nav SPC tornado/severe risks | Satellite/surface observations | Key ingredients | General links | NWS office links | Warnings
The key things to know from the experts, select images for more info at source
Today’s tornado probabilities
The probability of a tornado within 25 miles of a point. If a hatched area is included in the image, which is only done with probabilities of 10 percent or higher, strong tornadoes are more of a concern than normal. The following tornado probabilities correspond to each SPC storm risk category.
See also: Maximum tornado probabilities by month and year
2%, Marginal | 5%, Slight | 10%, Enhanced (hatch = EF2+ greater risk) | 15%, Moderate (as above) | 30%, Moderate (if no hatch) | 30%+, High (hatch = EF2+ greater risk)
Current outlook areas, radar, and convective watches
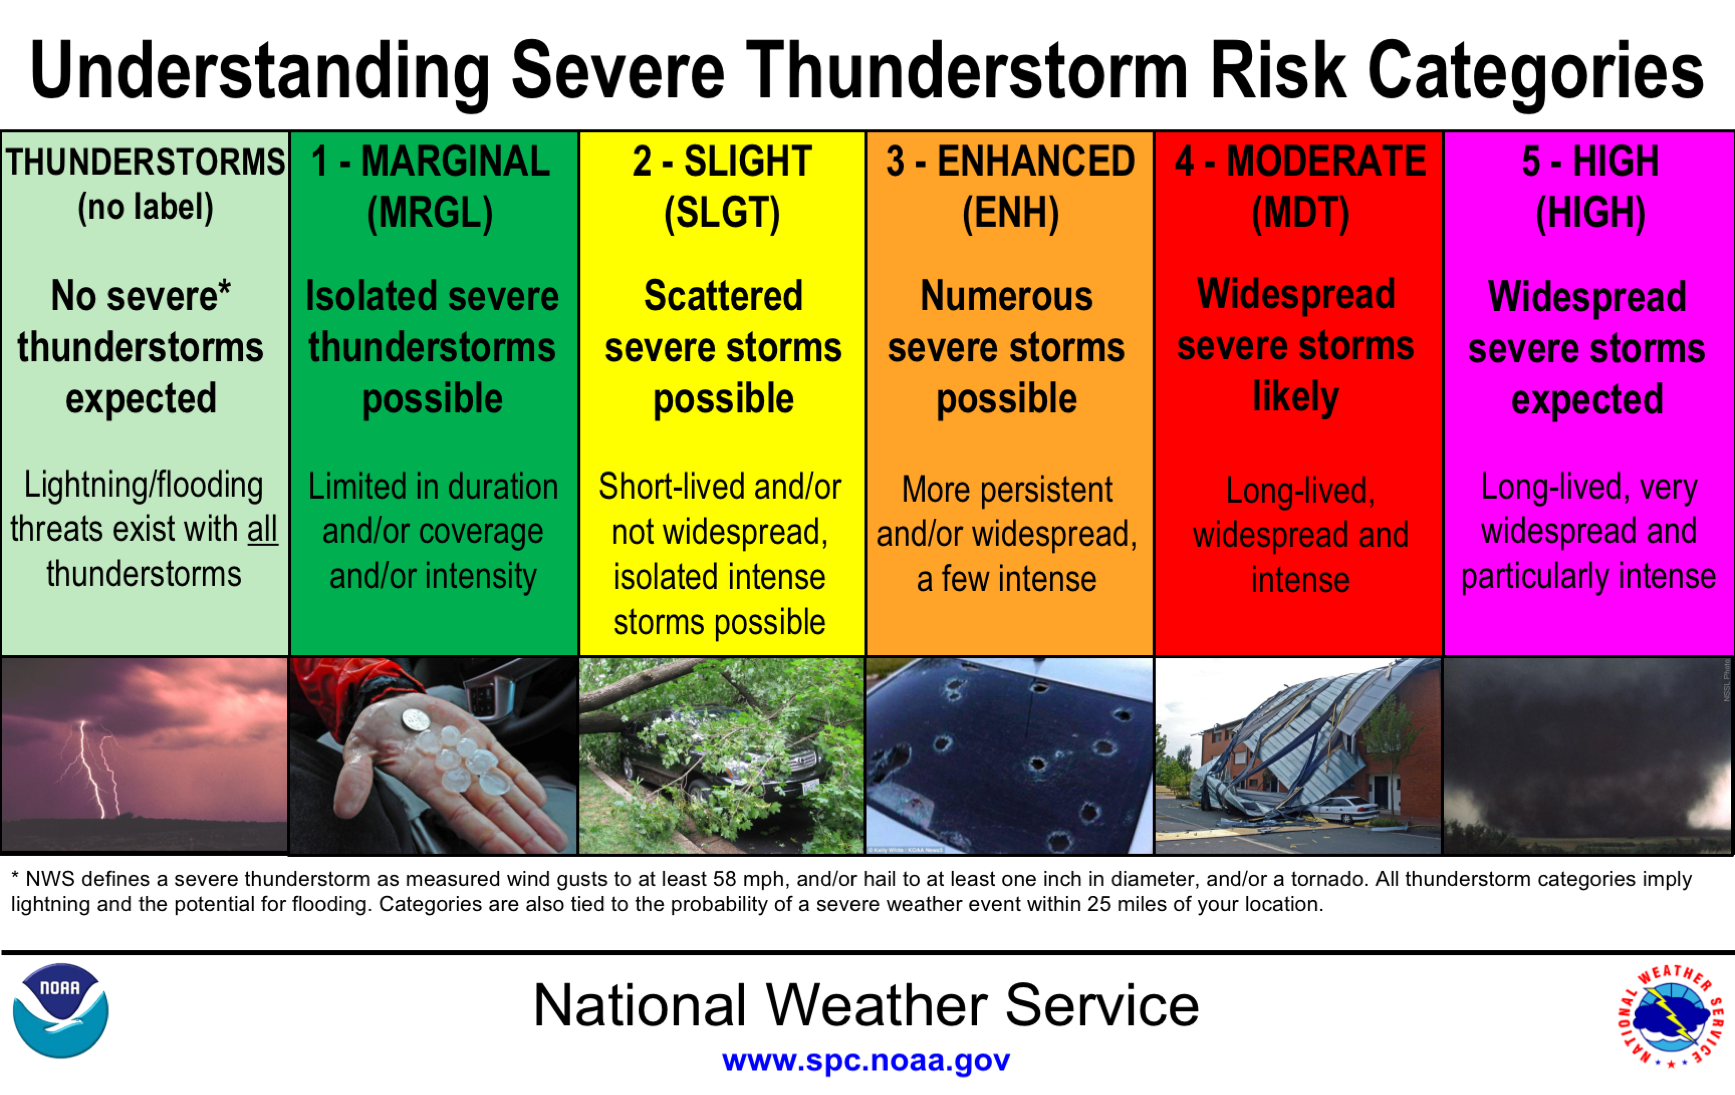
Organized categorical risk of severe storms begins with “marginal” (MRGL). Levels increase from there to “slight” (SLGT), then “enhanced” (ENH), to “moderate” (MDT), and finally “high” (HIGH). In a marginal risk, one might expect mostly non severe storms, with perhaps an isolated severe weather incident. Severity is up from there, from short-lived in slight to more persistent in enhanced, long-lived in moderate, and exceptional in high. SPC has a graphic covering differences.
Watches, either tornado (red) or severe thunderstorm (blue), indicate that storms are likely to pose the highlighted threat. Tornadoes also occur in severe thunderstorm watches fairly frequently.
The days ahead
Tomorrow’s tornado probability (outlook)
Day three severe weather outlook | Days 4-8 severe weather outlook
Viewing storms from space
College of DuPage | NASA Regional Viewer (Visible, Infrared, Water Vapor)
A look at the key environmental factors
U.S. surface features
A surface feature analysis often tells the basic story of any weather setup. High pressure? Probably sunny. Low pressure? Probably stormy. When it comes to tornadoes, your classic setups involve a low pressure system (little red L above) to the northwest or west of the area of primary severe risk. Other features that help produce tornadoes include wind shift zones like the warm front (red lines with half-circle bubbles pointing in the direction of movement), surface trough/dry line (dashed orange line, often connected to a low), and in some cases the cold front (blue line with arrows pointing in the direction of movement).
SPC mesoanalysis pressure plot
U.S. observations, including wind speed and direction
Weather observations are critical to any severe storm forecast. The chart above is a simple one, and similar to the general surface feature map just above. When it comes to tornado forecasting, the quick items to look for in actual station observations that aren’t explicitly in the features map include: surface winds and temperatures, as well as dew points (more detail on that below). A critical component in tornadogenesis is “backing” low-level winds. In many warm-season cases, that means a southeasterly wind or close. In general, winds with a lengthy southerly component will efficiently transport moisture northward. Where winds shift, fronts or boundaries can be found.
U.S. temperatures
U.S. dewpoints
These indicators are among the best
Surface based CAPE
CAPE, or Convective Available Potential Energy, is among the necessary ingredients for storms. If CAPE is zero, the atmosphere is stable. Measured in Joules per kilogram (j/kg), values near or over 500-1,000 j/kg are often about the low-end needed for widespread severe weather chances. Values over 3,000-4,000 are considered extremely unstable, often indicative of a high-end severe weather event. There are several layers of the atmosphere in which CAPE is measured, with surface CAPE among the most used to determine thunderstorm potential and gauge a severity ceiling.
A look at Cape | Examining CAPE
Bulk shear
Bulk shear, or deep layer shear, is defined as the change in wind speed or direction within the lowest 6 km or 3.5 miles of the atmosphere. Bulk shear values of 40 knots or greater are supportive of supercells. Values lower, say between 30 and 40 knots, may also support supercells or supercell structures depending on the terrain and other ingredients. Larger bulk shear values tend to correlate to higher tornado potential, to a point at least.
Severe weather forecasting tip sheet (NWS, PDF)
Cheat code
When it comes to 0-3 km CAPE and surface vorticity you look for the overlaps, go to them, and profit. Many people are saying Colin Davis was the first to call this a cheat code.
Supercell composite
Supercell composite is an index that includes several severe weather ingredients. The ingredients are effective storm-relative helicity, most unstable CAPE (muCAPE), and effective bulk wind difference. Values of 1 or greater indicate an increased potential for right-moving supercells, should storms fire or move into the region highlighted by the supercell composite index. More details can be found here.
Significant tornado
The significant tornado parameter (effective layer) is another composite index. Like the supercell composite, it contains several ingredients. The soup that makes up the significant tornado parameter includes effective bulk wind difference, effective storm-relative helicity, 100mb mean parcel CAPE (mlCAPE), and 100mb mean parcel height (mILCL). Values greater than 1 have been associated with a majority of tornadoes that have been rated significant/strong (which is a rating of F/EF2 or greater). Non-tornadic supercells, on the other hand, are often associated with significant tornado parameters of less than 1.
Surface-1km EHI
LCL Height
The Lifting Condensation Level (LCL) is the pressure level at which air reaches saturation upon being lifted. In more basic terms, it is often roughly where the base of a cloud should form as thunderstorm convection occurs during the warm season. Research has found that supercell tornadoes generally require LCLs below 1,500 meters. Strong tornadoes are more common with LCLs below 1,000 meters, and probably more in the 600 to 800 meter zone or lower. LCLs are often lower in a storm environment than shown in a large-scale analyses like above.
Hodographs! SPC recently added hodograph maps to their mesoanalysis. If you’ve seen our case archive, you know we love hodographs. Hodographs give a quick-look at the wind profile from the surface to the tropopause. Learning all the shapes can help your forecast immensely. Sadly, it is not available in CONUS so here are some direct links: South-Central | Central | North Central | Gulf Coast/South | Southeast/Mid Atlantic | Northeast/Great Lakes
Key sources for forecasting tornadoes and severe weather
General tornado forecast tools
PivotalWeather.com Models | TwisterData.com Data and Models | COD Meteorology Model Page | SPC Short Range Ensemble Forecast (SREF) Page | SPC HREF Ensemble Viewer | Colorado State University Machine-Learning Probabilities
Short-term tools
SPC Mesoanalysis Pages | Radar derived hodographs | SPC Observed Soundings | CONUS Radar Loop (large)
Medium-to-long term tools
CIPS historical analog guidance (extended analogs) | Experimental Tornado Probability Based on GEFS Reforecasts | CFS Severe Weather Guidance Dashboard
Tornado watching tools
Tornado Intensity Reference Guide
Lightning tracking
Vaisala lightning network | LightningMaps.org – Real Time Lightning
Area Forecast Discussions
Southeast
(FL) Tallahassee, Jacksonville, Tampa, Melbourne, Miami, Key West (GA) Atlanta/Peachtree City (SC) Columbia, Charleston, Greenville/Spartanburg (NC) Wilmington, Morehead City, Raleigh
Mid-South
(AR) Little Rock (LA) Shreveport, Lake Charles, New Orleans (TN) Memphis, Nashville, Morristown (MS) Jackson (AL) Huntsville, Birmingham, Mobile
South/central Plains
(TX) Amarillo, Austin, Brownsville, Corpus Christi, Fort Worth, Houston, Lubbock, Midland, San Angelo (NM) Albuquerque (OK) Norman, Tulsa (KS) Dodge City, Goodland, Topeka, Wichita (CO) Denver, Pueblo
North/central Plains
(NE) Hastings, North Platte, Omaha (WY) Cheyenne (SD) Aberdeen, Rapid City, Sioux Falls (ND) Bismarck, Grand Forks (MT) Billings, Glasgow
Places at risk now or in the recent past
(return to top)
This page is undergoing development.
View Comments
what does slgt mean
"SLGT" is a shortened form of "slight" risk on the convective outlook map.
There should be an "EXTREME" Risk, were Strong Winds Are 100% Happening, EF3+ Tornadoes, Big Hail, Long Tornado Outbreak. Extreme = EXE
They call that a PDS, or a Particularly Dangerous Situation.
WOW! YOU ARE REALLY SMART!!!! WOW!!!!!!!!
Don’t get to ahead of your self, but he is pretty smart!
They call that a PDS, or a Particularly Dangerous Situation.
Hi it’s Hannah Babcock and I want to ask you something what should I do to be a tornado tracker and chaser
Learn everything you can then learn more. Then go chasing with an experienced chaser or book a storm chasing tour. At that point you should know how to stay safe and enact good strategy. Tim Valquez (spelling may be off) has a great book to read called the storm chasers handbook. Beyond weather you need to know how to chase safely and have courtesy toward land owners locals and other chasers.
I am planning to be a storm chaser too! thanks for the idea i check the radar plus there were 7 spots in florida where some of them happen!
Idk man
Do you think there will be a tornado tomorrow in Ohio May 29 2019
that was the day i was in school and everyone got a tornado warning on their phones when i was in rowlett, tx but the tornado went to rockwall
i am at school and we got a tornado warring to😨😰😰
Slight risk. Currently the first of three levels of severe outlooks from SPC, though this will be changing quite soon. Here's something of an overview of both the original and the upcoming: http://www.washingtonpost.com/blogs/capital-weather-gang/wp/2014/01/15/weather-service-proposes-expanded-number-of-severe-weather-risk-categories-in-2014/
Or from SPC: http://www.spc.noaa.gov/faq/#3.3
What does mrgl and mdt and enh
Hi Romanatwood. They represent "Marginal", "Moderate", and "Enhanced" risk for severe weather. Go to the links Ian shared in his reply above, and they will explain what each type of risk means.
Is there a tornado today in Anna TX
well there is
Hahhahahahahahha loser doe
Thanks
I <3 tornados!
For sure
I HAVE a chance of a tornado
what is a "tornados" do you mean tornadoes?
Relax, they probably just forgot the "e". And you're making a big deal out of one mistake as if you've never made one before.
thanks so much for a wonderful site with an enormous ammount of CLEAR information!
How does convective available potential energy, bulk shear, lifting condensation levels and energy helicity index all work together for types of storms that tornado chances are higher in? I'd like to be a meteorologist some day. I'm very interested and I have been for awhile. Thank you for this site that shows all of the facts. It has been helpful👍👍
Thanks you for this site that shows all of the facts,it has been helpful
I <3 weather!!
Thanks for this awesome site!