A large tornado event, such as the recent outbreaks on 10 February (including the Hattiesburg, MS EF4) and 30 January (including the Adairsville, GA EF3), often sparks a big buzz in social media and weather discussion communities revolving around the damage left behind. In particular, discussion often focuses around speculating what the worst/most significant tornadoes will be rated.
Admittedly, it’s hard not to look at pictures of severe damage and try to understand what kind of force it takes to produce that kind of churned landscape.
In light of this, and with the approach of the heart of tornado season (perhaps even some additional significant severe weather before winter ends), I want to point out a just few ways in which estimating tornado damage strictly from pictures can be misleading, and in turn show some of the complexities behind a thorough tornado damage survey. Below, I’ll examine a series of pictures from different tornadoes, and explain how each can be misleading on its own.
First off…
Credit: NWS Louisville
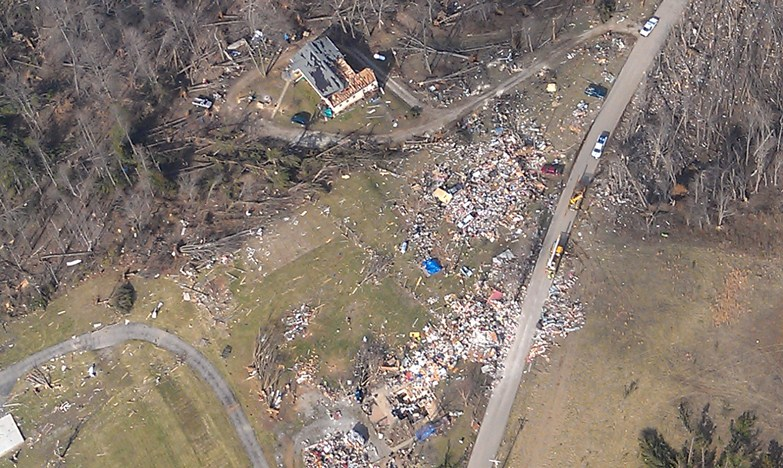
The above photo shows an area severely impacted by the Henryville, IN tornado on 2 March 2012.
From this picture alone, the casual observer might quickly come to the conclusion that this tornado was EF5 intensity at this location, with the house at the bottom of the photograph swept off its foundation. In this case, however, even just a ground-level photograph can help paint a different picture.
Credit: NWS Louisville
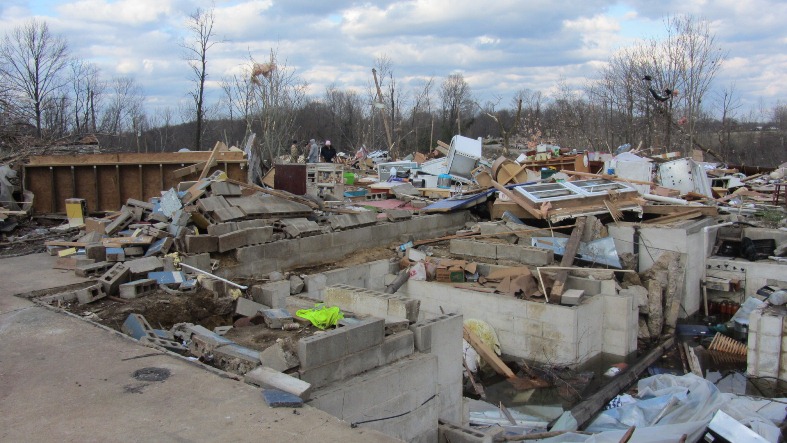
The ground-level picture of this damage site, along Daisy Hill Rd. in Washington County, IN (side note: this area was also impacted by an F5 tornado during the 1974 Super Outbreak) shows a critical structural flaw in the construction of this residence.
Note that the foundation is made of cinder blocks (many of which were even tipped over) and that there is little evidence of anchoring to the foundation. With such weakness at the foundation, a home can easily slide off with a strong horizontal wind.
This sort of destruction is further supported by the fact that large pieces of debris, including a window and part of a wall, remain intact nearer to the foundation. This backs up the idea that the winds, though quite intense, were not of EF5 intensity at this location. The Henryville tornado was still a major violent tornado, killing 11 and doing EF4 damage in four separate southern Indiana counties.
Next up..
Credit: NWS Chicago/Romeoville
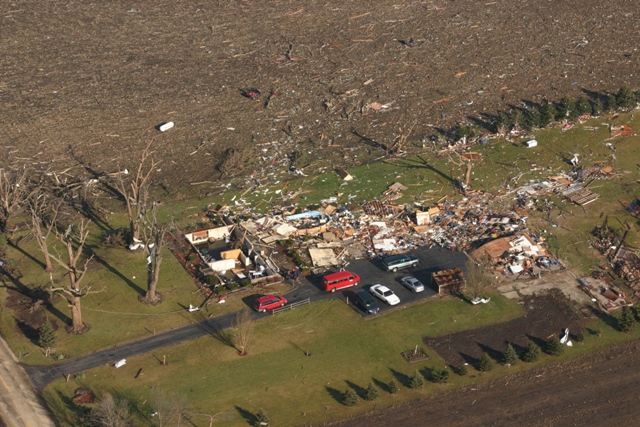
This picture was taken in the wake of a tornado that struck Boone County in far northern Illinois, just east of Rockford, on 7 January 2008 (yeah, that’s right, I said January).
A two-story farmhouse that had been on this foundation. The debris is even more removed from this homestead than from the one pictured above in the Henryville tornado.
Credit: NWS Chicago/Romeoville
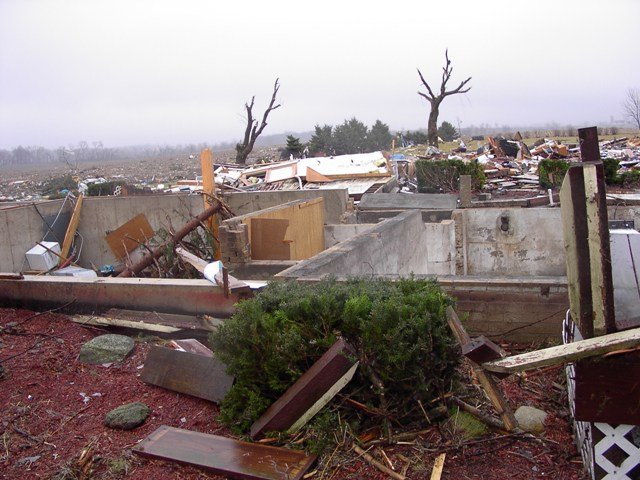
A few things stand out in this picture, one of which may initially lend a person to believe that this was indeed a violent EF4/EF5 tornado. The first point is that, unlike the house pictured from the Henryville tornado above, this one was built on top of a poured concrete basement foundation. The second is that debris from the house is not pictured sitting right next to it, like debris from the house impacted by the Henryville tornado above.
But there are some glaring issues here. To start, the wooden porch is still mostly intact next to the foundation. The other issue is that the bushes immediately surrounding the foundation are still in relatively good shape. And in fact, if you look closely at the foundation, you can only note a few bolts sticking out of the foundation. This house, once again, was not adequately secured to its foundation. Thus, this damage (and the tornado as a whole, since this was the most severe damage along the path) could only be rated high-end EF3.
It goes both ways…
Credit: NWS Jackson MS
In the wake of the recent Hattiesburg, MS tornado of 10 February 2013, the first and primary focus of damage coverage was around the University of Southern Mississippi. Widely circulated were photos of an apartment building with this wall ripped out, shown above, as well as other structures near the university.
Very little information was initially made available from earlier in the track, back to the southwest in Lamar County. Thus, much of the speculation in the social media and elsewhere focused on damage pictures similar to the one above. It seemed “clear” that the Hattiesburg tornado would be rated EF2 or EF3.
Credit: NWS Jackson, MS
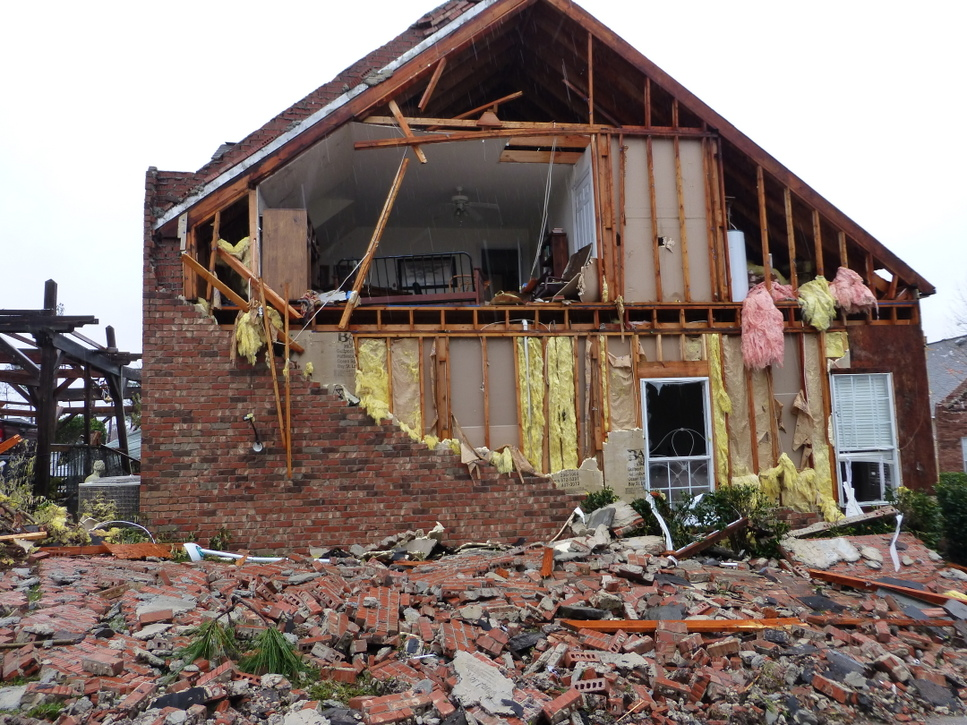
Then came the damage pictures from West Hattiesburg and Oak Grove.
The house pictured above was a well-constructed home that was leveled to the ground, certainly worthy of an EF4 rating. There were no pictures (to my knowledge) of the damage in this area circulating in social media in the immediate aftermath of the tornado. This is a case where a focus in reporting or a population bias can make it very difficult to judge just how significant a tornado event was, especially in the immediate aftermath.
Now for a challenge… if a tree falls in a forest…
Credit: Tony Lyza/University of Alabama in Huntsville Atmospheric Science Department
Sometimes, the most intricate and thorough tornado damage surveys are the ones that raise the most questions.
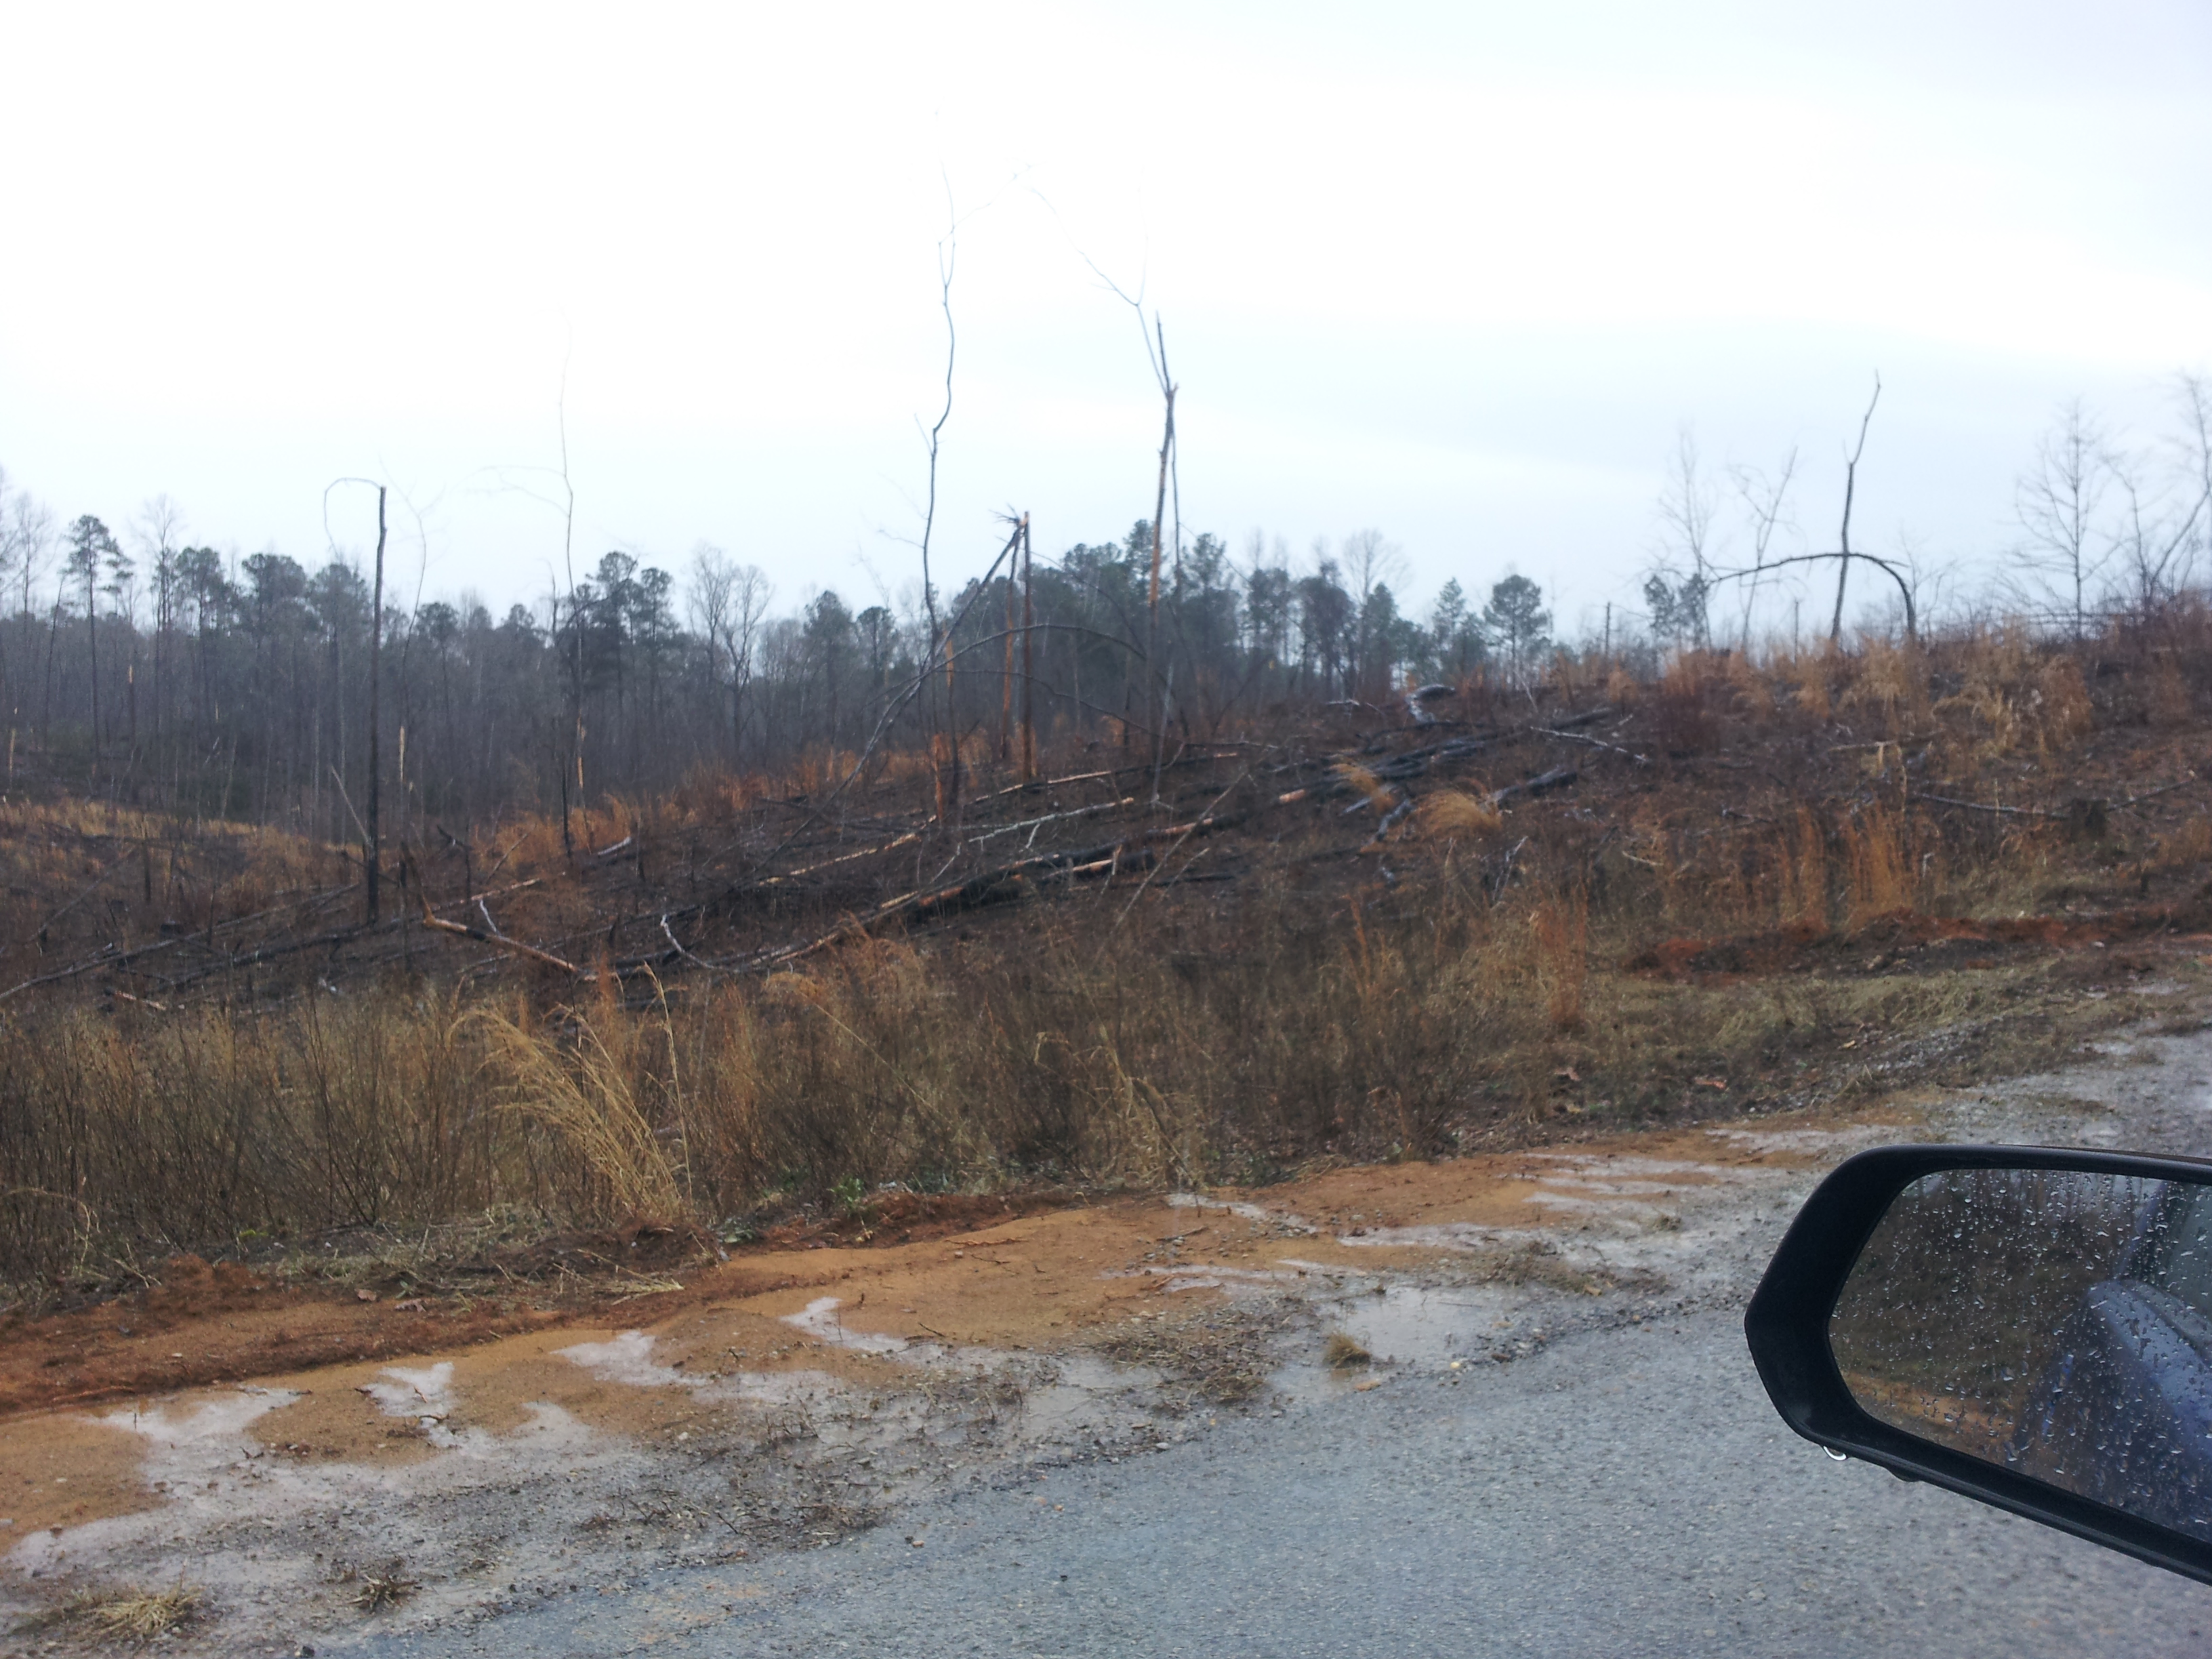
In the wake of the 30 January tornado outbreak, I performed a survey of tornado damage for my research purposes at UAH. I surveyed the path of a large tornado that struck around 550-600 a.m. CST (1150-1200 UTC) near the Lewis Smith Lake reservoir in Winston County, AL. This is a sparsely populated area that is largely comprised of land belonging to either the Bankhead National Forest or to private hunting clubs. The picture above was taken in the first half of the 10-mile-long track, in the Black Pond community southeast of the town of Double Springs.
My first reaction to coming across this area was that something very significant had occurred here. Then I began to look closer. Something didn’t seem quite right with this damage. Even though the area was smack in the middle of the track of this tornado (approximately 1/2 mi wide at this point), the area seemed too cleared of branches and trunks to have this scene be completely natural. However, it was hard to tell for certain due to the terrain and the poor contrast. To make matters worse, the Google Earth imagery available immediately after the survey did not show any significant deforestation.
Credit: Google Earth
The picture didn’t clear up even after contacting forestry officials, who had no record of recent clearing or significant fire activity.
It was beginning to seem as though this area had actually been impacted by a very significant tornado, with tree damage that would likely support EF3 intensity. However, something still didn’t sit right with me about the area, so I kept digging. After getting in contact with a couple local landowners a week after performing the survey and after receiving updated Google Earth imagery, the story started to gain clarity.
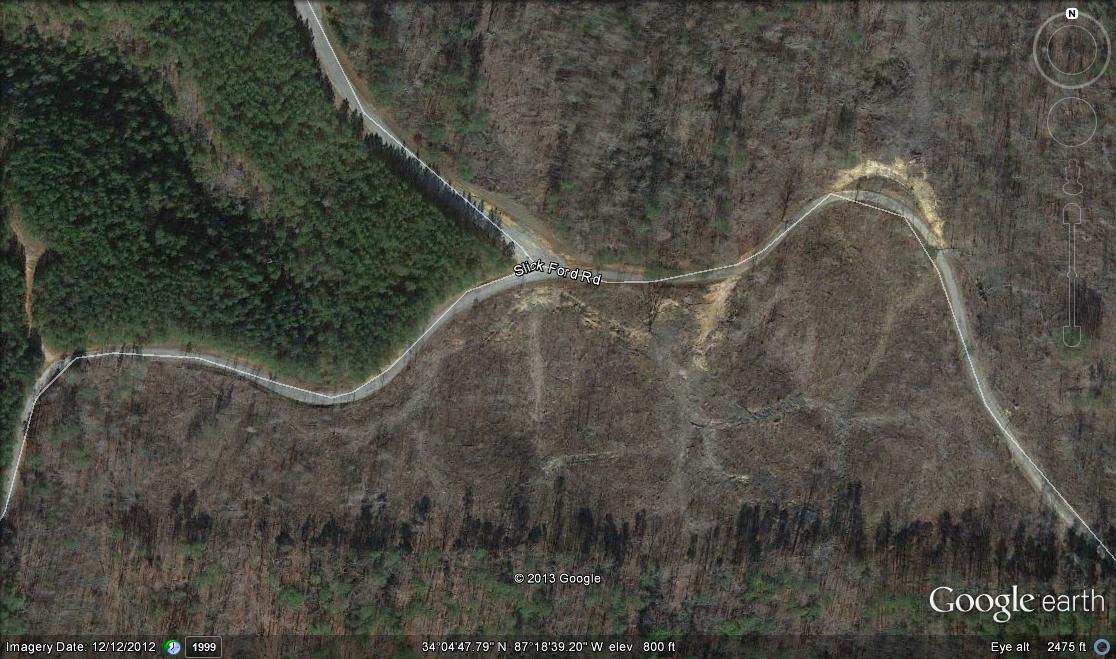
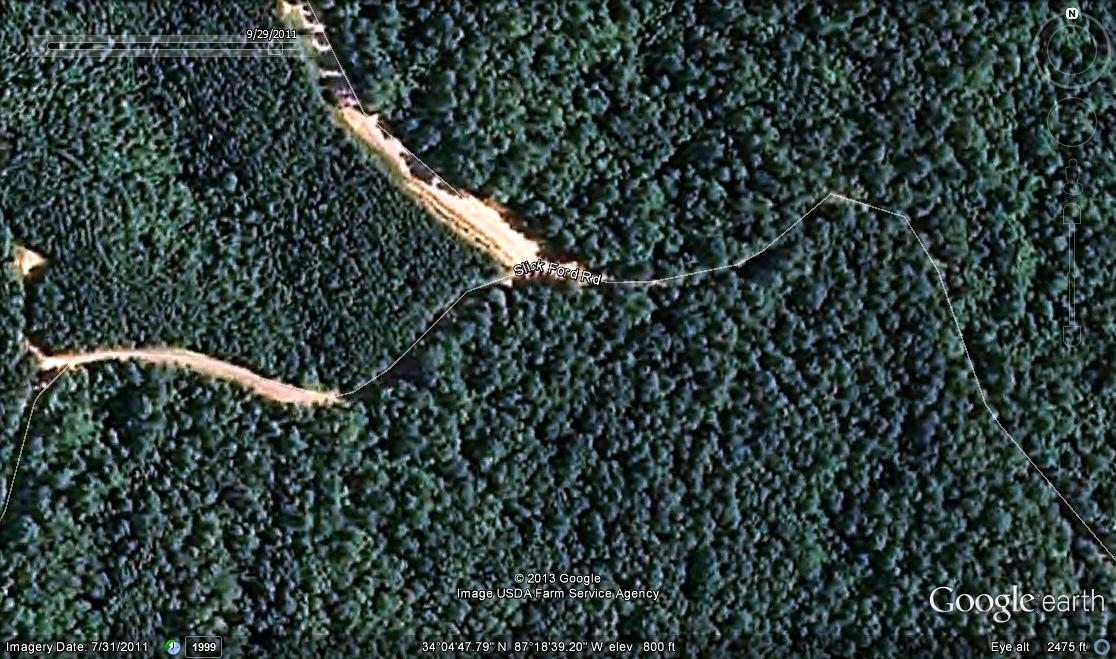
Credit: Google Earth
The above image, taken on 12 December 2012, clearly shows significant deforestation that had occurred prior to the tornado impacting the area on 30 January. This does not change the fact that some trees still standing in the path of the tornado were partially debarked or the fact that this tornado snapped and uprooted thousands of additional trees.
It does bring into question, though, just how healthy some of the trees, especially the debarked trees that were in or near the logged area. Why were these trees left? Why weren’t they logged? Were they healthy or diseased?
With no good way to find an answer to these questions, it’s impossible to argue the high-end EF1 rating given by the National Weather Service in Birmingham for this tornado, even if there is still seemingly evidence, even after taking the logging into account, that a higher rating, perhaps EF2, *could* be supported.
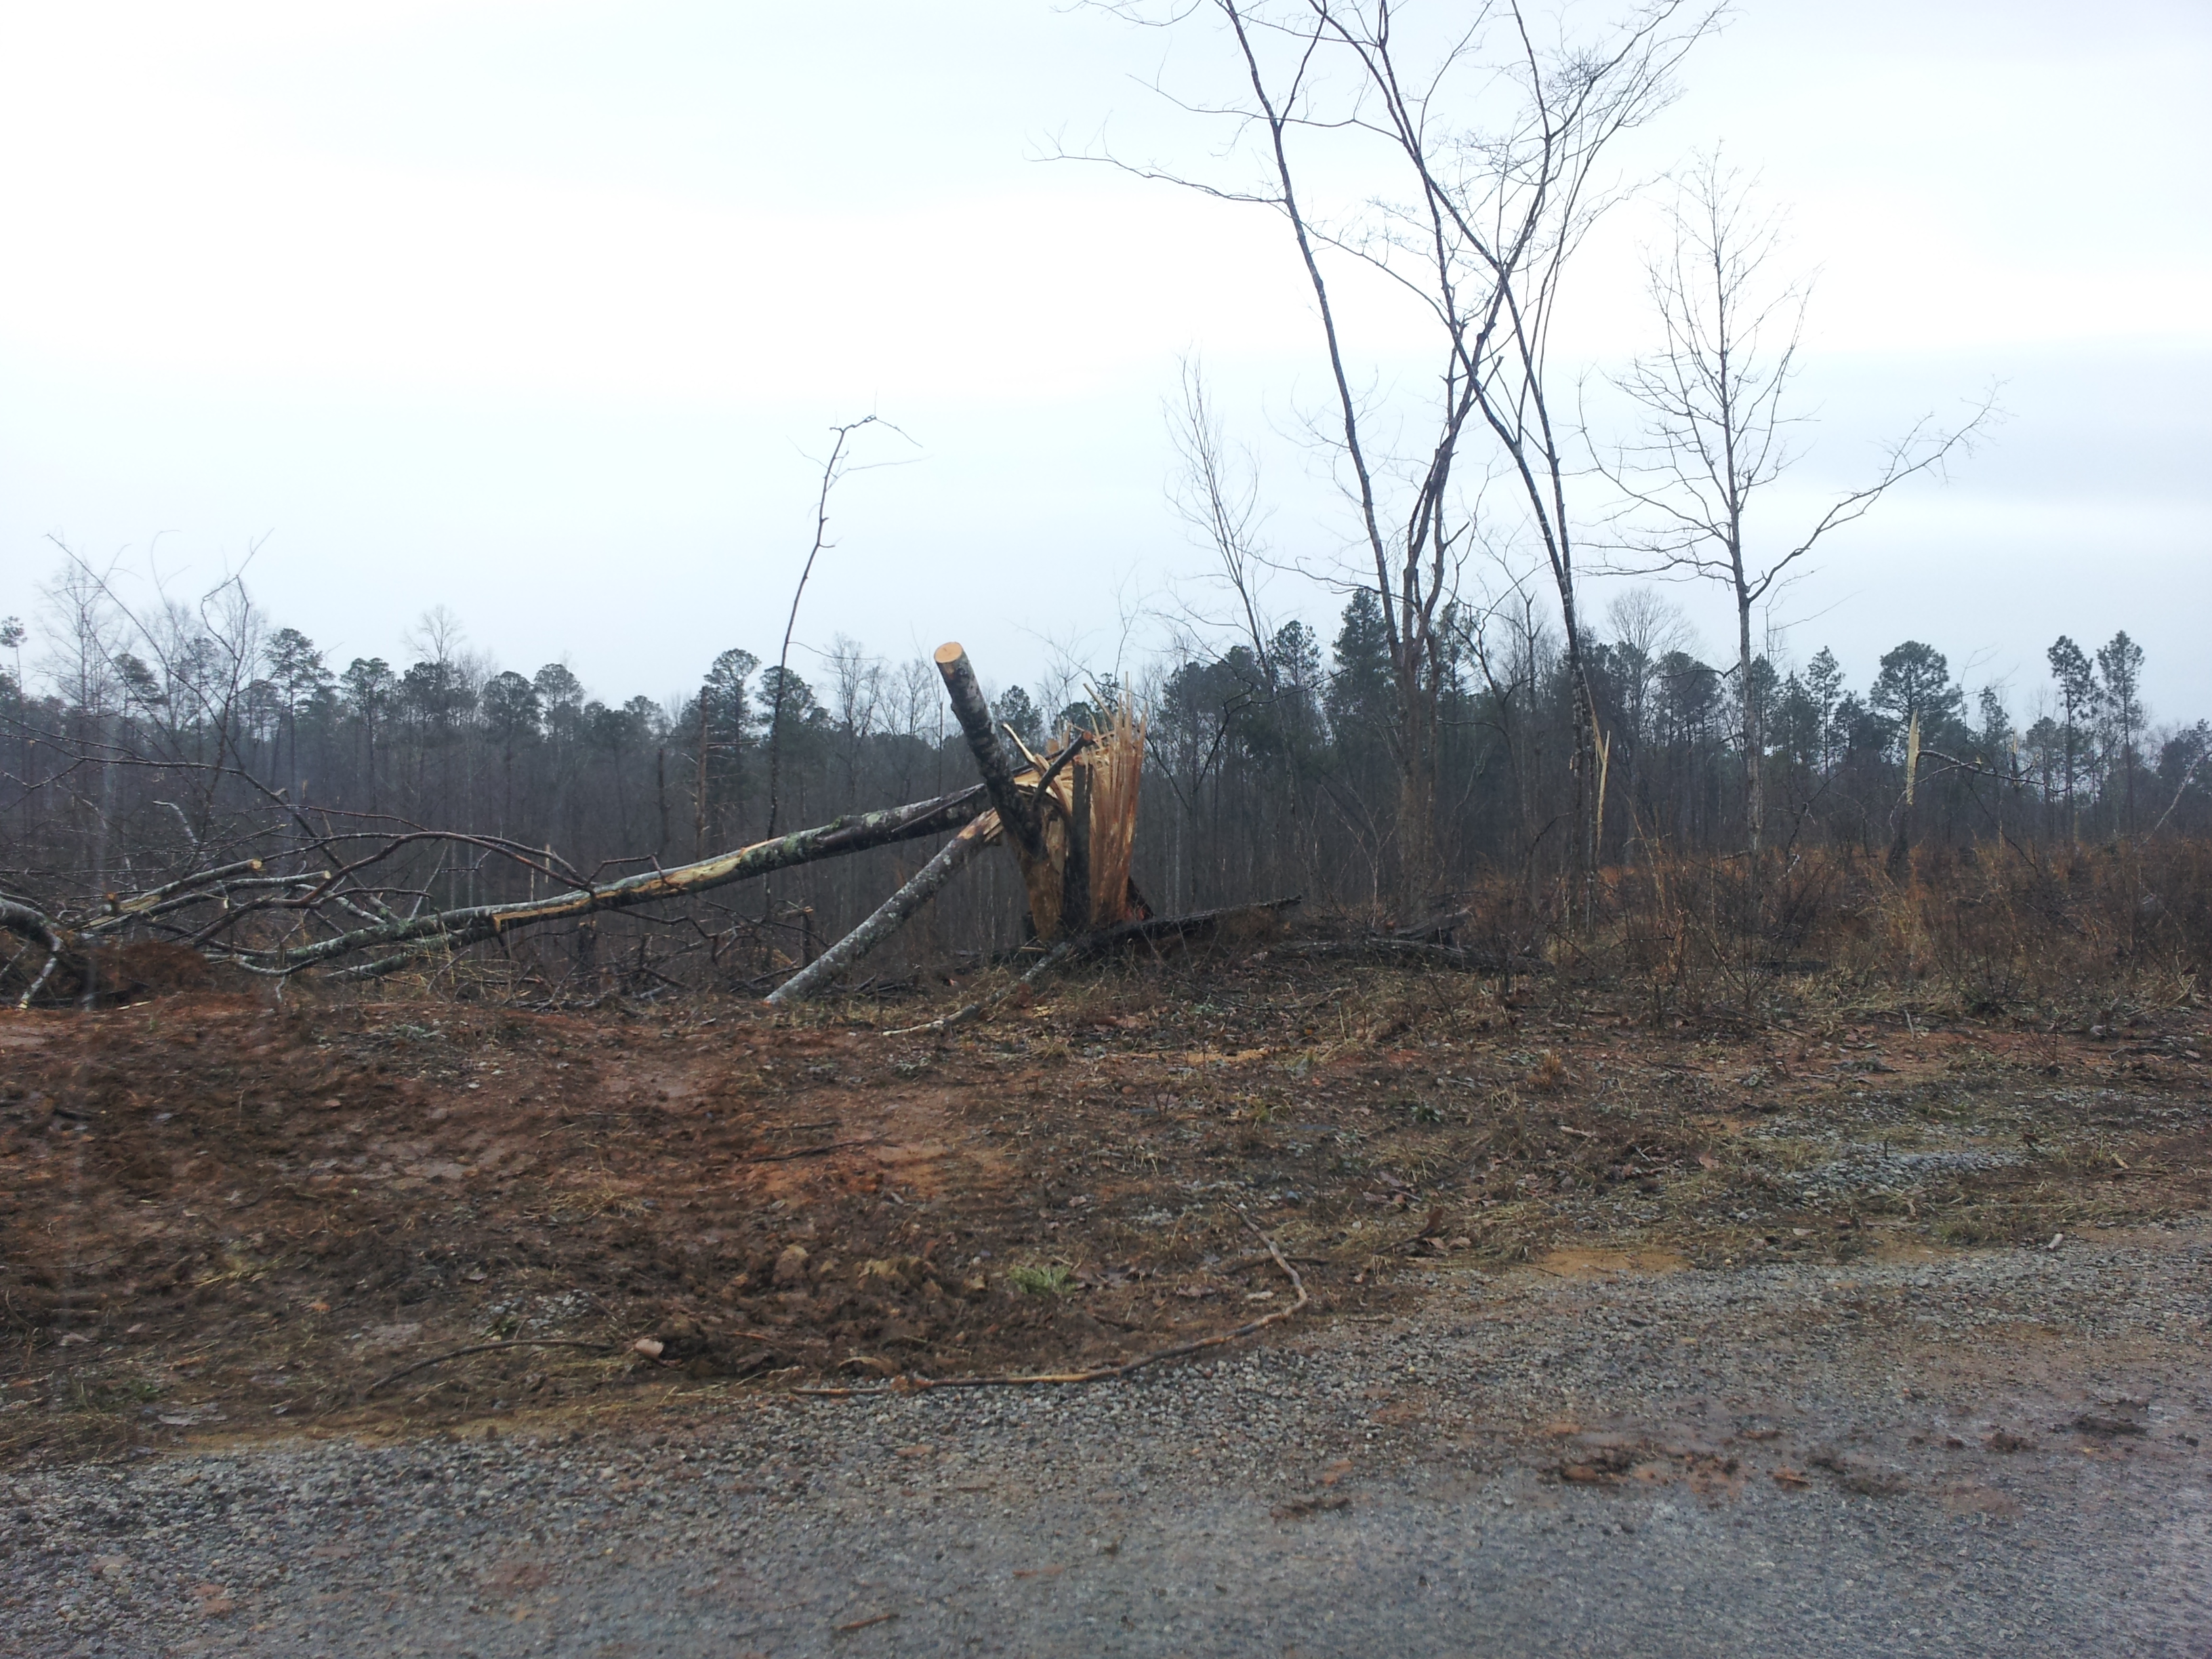
Credit: Tony Lyza/University of Alabama in Huntsville Atmospheric Science Department
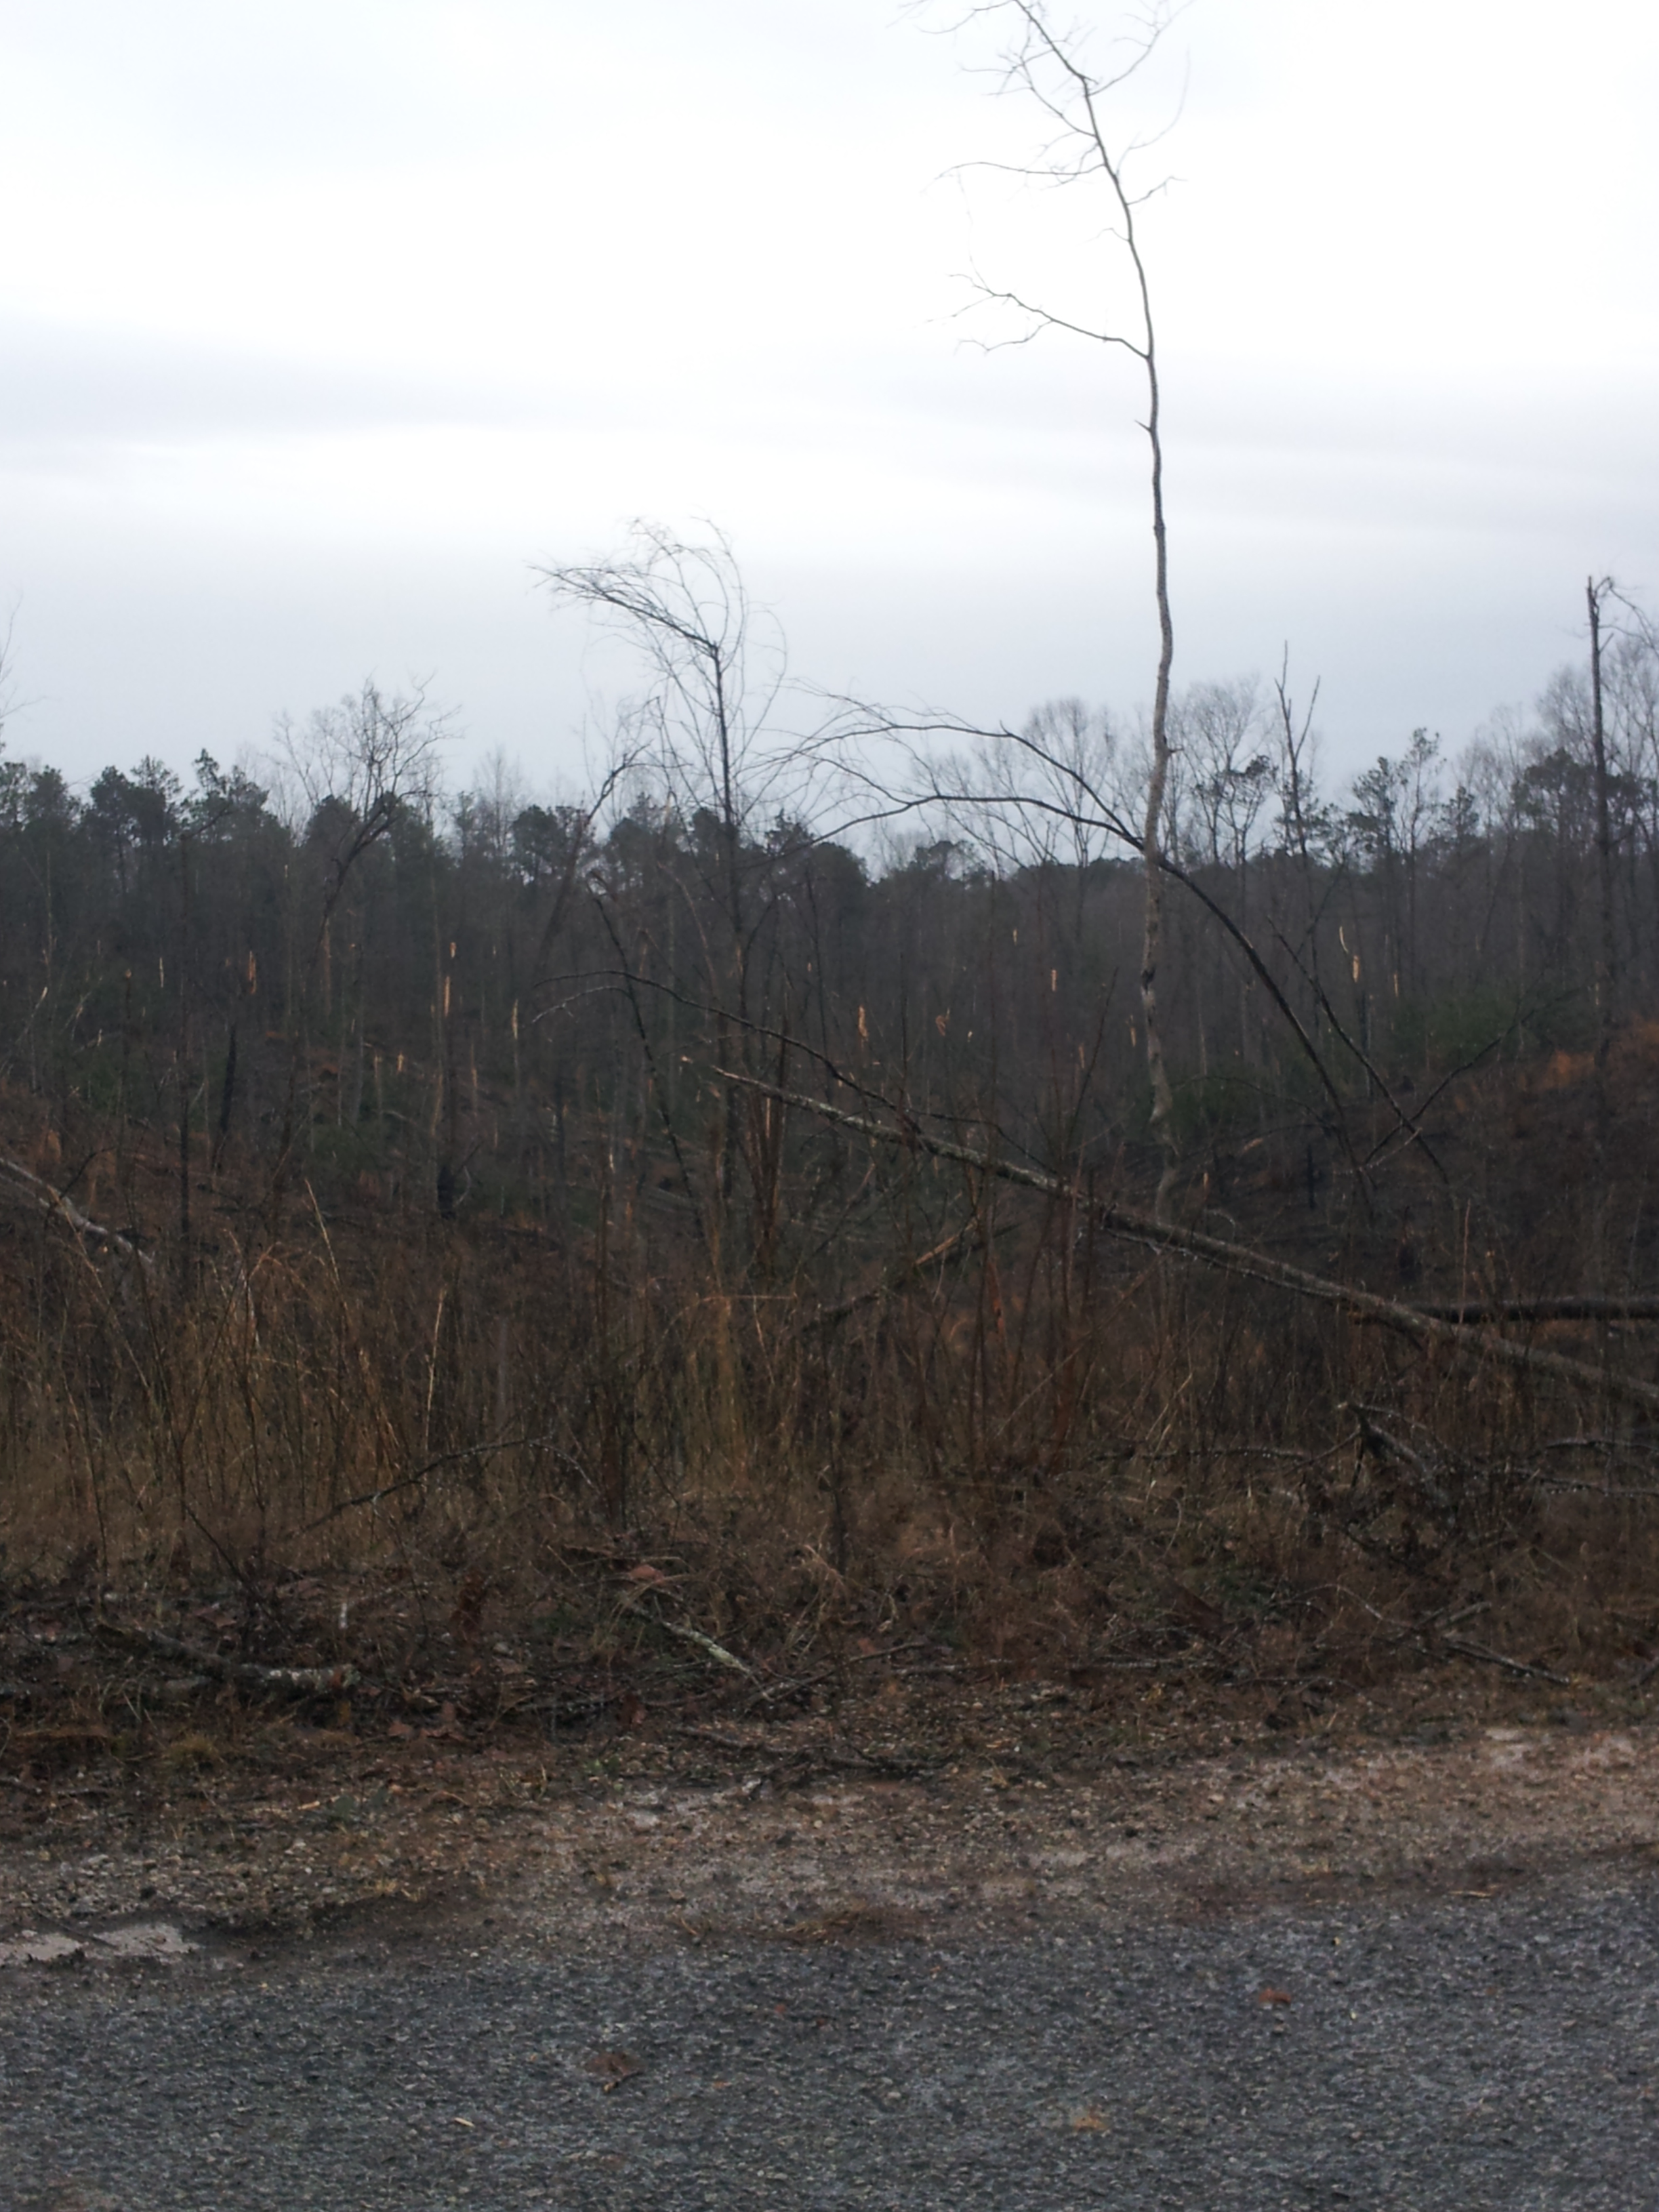
Credit: Tony Lyza/University of Alabama in Huntsville Atmospheric Science Department
Next time there is a significant tornado event, remember that very rarely can the first sets of pictures tell the whole story…
Tony Lyza
Latest posts by Tony Lyza (see all)
- 2014’s EF3+ tornado drought: The latest in the year on record without one - April 8, 2014
- Tornado Damage Surveys and Ratings: Why Pictures Don’t Tell the Whole Story - February 19, 2013
- Quick Update: Tornado Outbreak Likely Christmas Morning through the 26th - December 24, 2012
At first glance, the EF scale seems to have many of the same weaknesses that the Mercalli intensity scale has in determining the force of earthquakes. Both scales focus on the effects rather than the strength. A weak tornado or earthquake could cause considerable destruction if the construction is not sturdy or well-anchored in the first place. The Mercalli scale has been supplanted by the better-known Richter scale–which is based on magnitude–and is the first reading given in reports of earthquakes. Here is a Wikipedia article about the Mercalli scale: http://en.wikipedia.org/wiki/Mercalli_intensity_scale
Tony,
Good article and good to see others mentioning this issue. Almost as important as what is damaged is looking at what is not damaged. And certainly without knowing the structural details of the home it is very easy to overestimate the wind speeds. We encountered this issue several times in our Tuscaloosa and Joplin surveys.
And in reply to the comment above, the EF scale is supposed to take construction into account by using the range of values associated with each Degree of Damage indicator. Still a very subjective process however and not sure how many truly understand the rating system.
Thanks David! Tornado surveying is certainly no small task, especially when you’re not a civil engineer (which I certainly am not), or, in the case of a tornado like the one near Smith Lake, a biologist/ecologist.
To add to your reply to Joel’s comment, the EF-scale was derived through an expert elicitation process. That is, a panel of damage survey experts were each given the list of proposed damage indicators and asked to estimate the wind speed needed to produce each level of damage. From there, the degree of damage values and lower/upper bounds were derived.
We will never have anything like the Richter scale for tornadoes. Most instrumentation cannot withstand tornado-force winds (especially strong-violent tornadoes), but that’s actually the lesser of two problems. The bigger problem is actually sampling the “strongest” part of a tornado with instrumentation. Recent modeling research suggests that the tornadoes have a maximum in wind velocity no more than a few hundred meters from the ground, and likely much closer than that. In order to sample those winds with a radar, we would have to have a radar incredibly close, but still far enough away that the tornado is in the sampling range. In addition, the maximum winds inside a tornado often occur in multiple vortices, at length scales smaller than what can be resolved by even high-resolution radars.
The problem also holds true for in-situ observations. If we were to have an true intensity-based scale, we would have to have almost every square foot of the country contain an instrument that could withstand a violent tornado in order to have the shot at sampling the peak winds of every single tornado. Damage alone will never be able to tell us precisely what the wind speeds in a given tornado were. And thus, we will always have a damage-based scale for tornadoes.