It’s almost that time of year again. Sure, it’s always that time of year to some degree, as we’ve detailed in length here and the map animation above shows.
In a winter invaded so frequently by Arctic outbreaks as the one currently heading toward its end, 2014 is off to a historically slow start (seems to be the story of late?). While any uptick in activity will sure to be noticed, it’s of course early in the year to think too much about deficits. And watching the animation, you can certainly see why the main focus is typically on April through June.
Below are all the maps that make up the animation individually, if you want to take a deeper look at any month in isolation:


The following two tabs change content below.

Katie Wheatley
Katie currently works as a GIS Analyst for EA Engineering, Science and Technology, Inc., PBC in Hunt Valley, Maryland. See full bio.
Latest posts by Katie Wheatley (see all)
- March 29-31, 2022 tornado outbreak - April 3, 2022
- March 25, 2021 tornado outbreak - March 25, 2021
- May 3-4, 1999 tornado outbreak and the Bridge Creek-Moore F5 - May 3, 2019
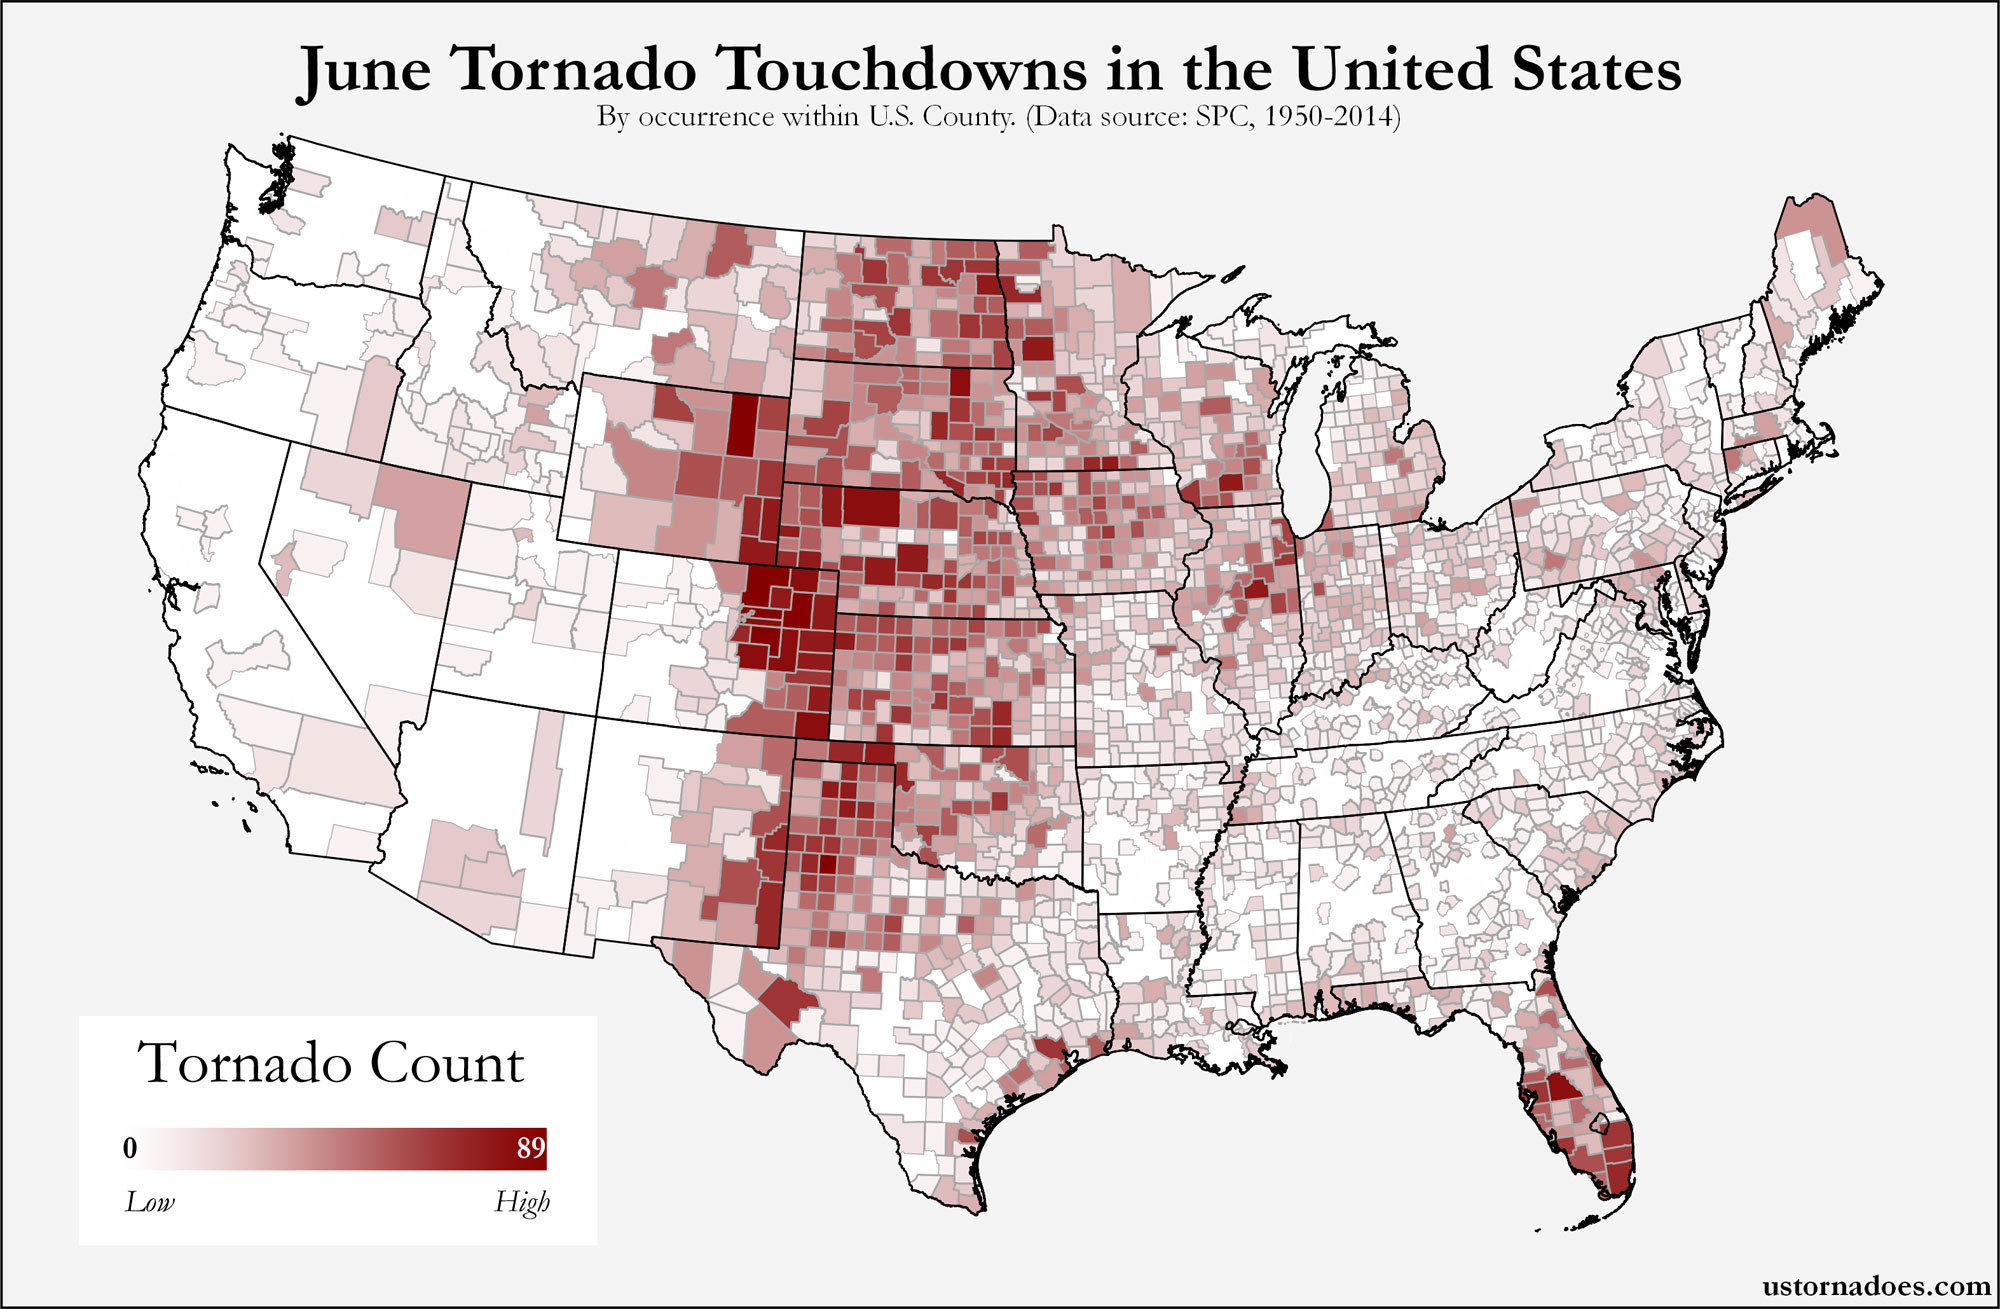
Thanks Katie for the interesting map / graphics. What I find most interesting is the decline in tornadoes in Florida from June. I would have expected a jump in FL during tropical storm season as it seems many tropical cyclones have tornadic activity associated with them. Nice job on this!