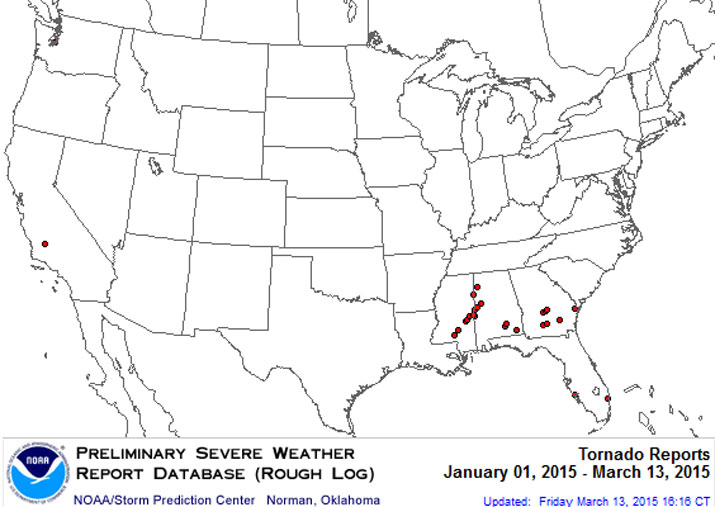
2015 is off to a slow start for tornadoes in the United States. Through today, only 28 tornadoes have occurred anywhere in the country, with the majority of these (23) coming in a two-day event on January 3-4 over the Southeast. These numbers are still preliminary as compiled by the Storm Prediction Center, but have been filtered temporally ans spatially for duplicate reports.
The number since January 5 is even more noteworthy, with a preliminary total of only five tornadoes reported. Of these five, two occurred in Washington State on January 18, one occurred in Florida on January 23, another occurred in Florida on February 5, and one occurred in California on February 23. No tornado reports have been received thus far in the month of March.
Dr. Greg Forbes of the Weather Channel reports that this is only the second time March has gone tornado-less through the 16th since 1950, with the only other occurrence being in 1969. I am reasonably confident that this number won’t change much in the next seven days (see below). For reference, the average tornado counts by month are 35 in January, 29 in February, and 80 in March.
And it’s not just the tornadoes that have been quiet: It’s all severe weather.
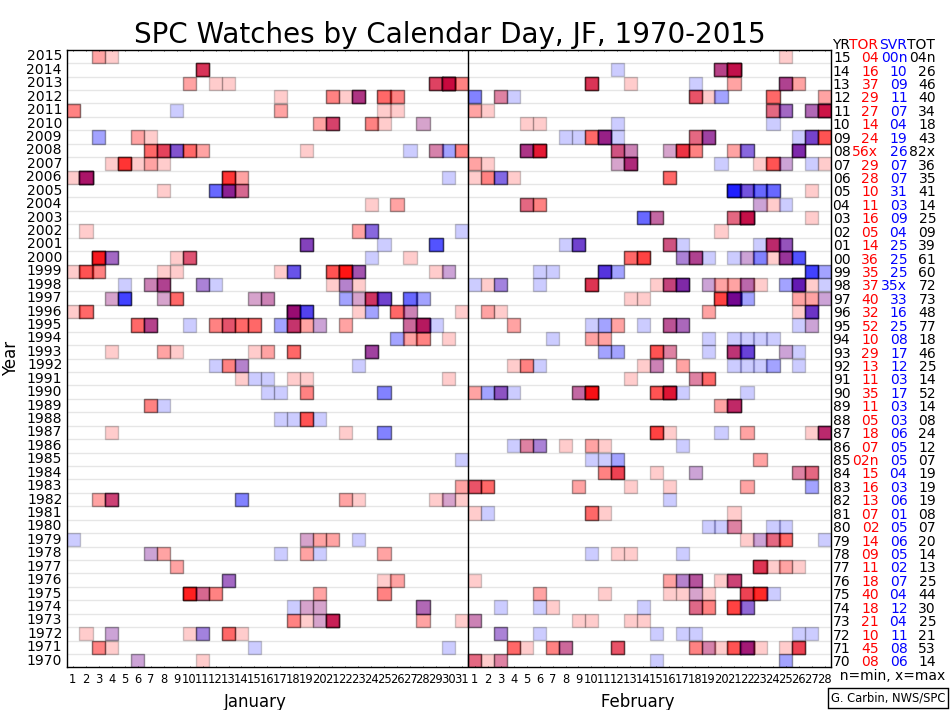 Storm Prediction Center watch counts by year. 2015 is off to a record low start. Image courtesy SPC/Greg Carbin.
Severe weather — defined as hail one inch or greater in diameter, wind gusts 58 mph or higher, or a tornado — has only been reported on 14 of the 75 days so far in 2015. The Storm Prediction Center has only issued four tornado watches so far this year (two on January 3, one on January 4, and one on February 25) and no severe thunderstorm watches.
This easily ranks as the lowest watch count through this date since at least 2004 and the 51-day gap between watches ranks as the 6th longest such period since 1975 and the longest such period since 1986. All of this begs the question: Why has it been so quiet?
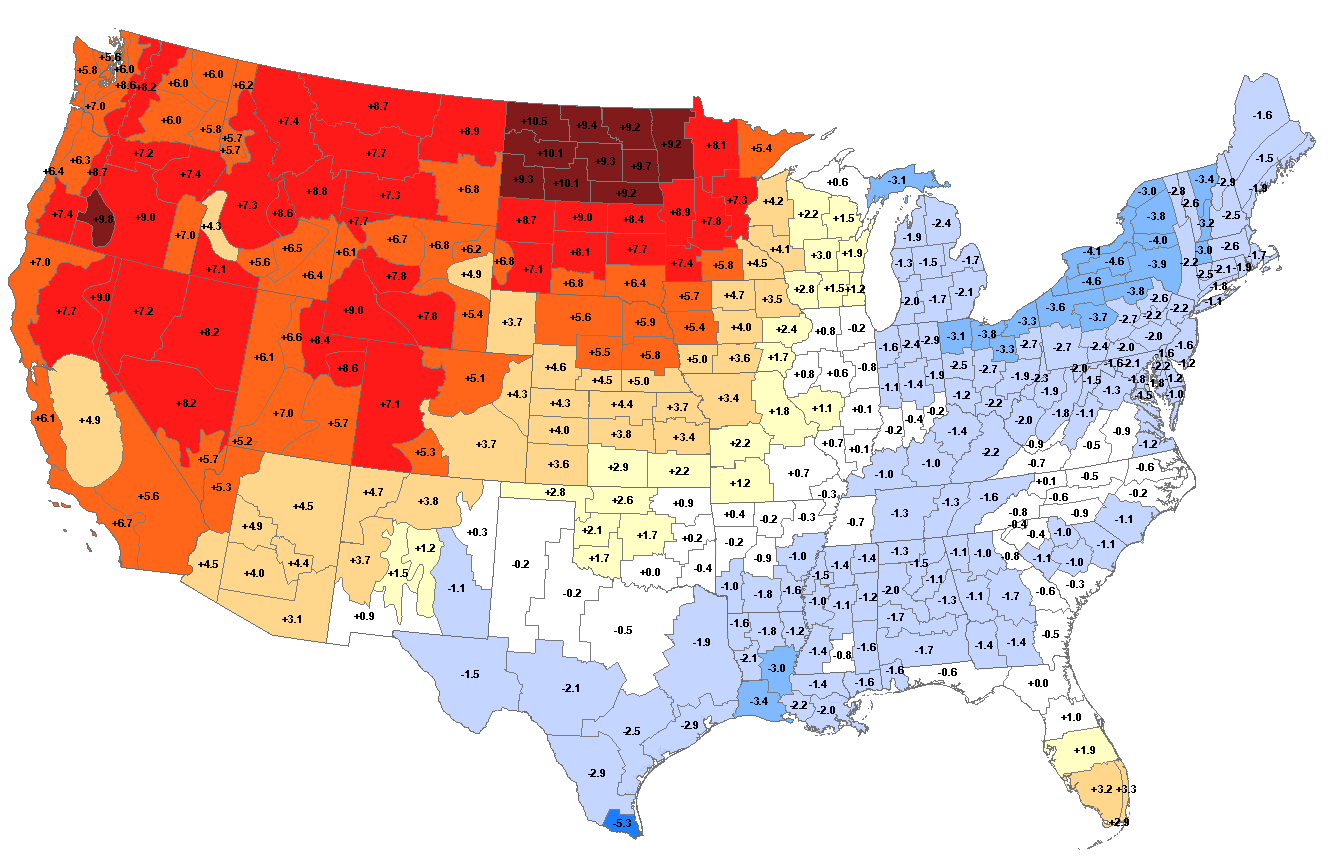
Maps of surface temperature anomaly in F for January 2015 (top) and February 2015 (bottom). Maps courtesy NOAA/National Climatic Data Center.
Maps of temperature departure from average for both January and February 2015 are shown above.
These plots indicate that the eastern U.S., particularly the Northeast, has generally seen below average temperatures so far this year, while the West has enjoyed temperatures that have been above average. It is also apparent that the magnitude of the anomalies (warm in the west, cold in the east) was much greater in February than in January, owing to both the intensity and and persistence of the bipolar temperature extremes in February.
All thunderstorms – and thus all tornadoes – require instability, most commonly seen as warm and moist air near the surface, in order to form. Given that most tornadoes in January, February, and early March occur in the Gulf Coast states, the relative paucity in tornado reports should not be altogether surprising.
To examine the cause of these temperature extremes, the average upper-level (500 mb) trough/ridge pattern for both January and February is displayed below. On these maps, warm colors are associated with positive height anomalies (upper-level ridging) while cool colors are associated with negative height anomalies (upper-level troughing).
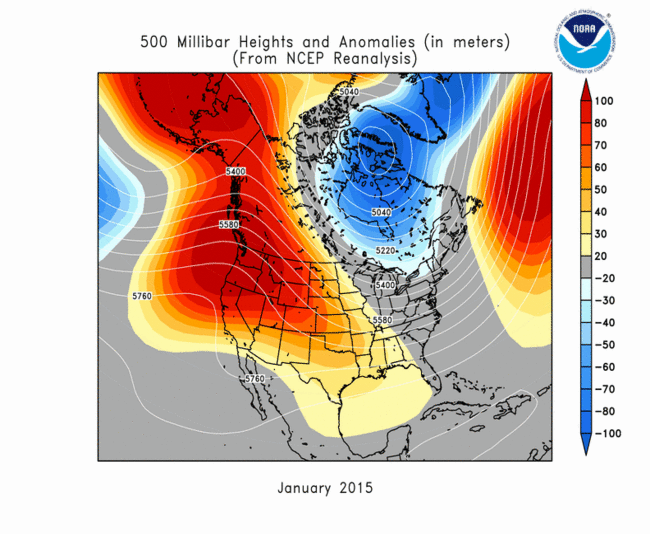
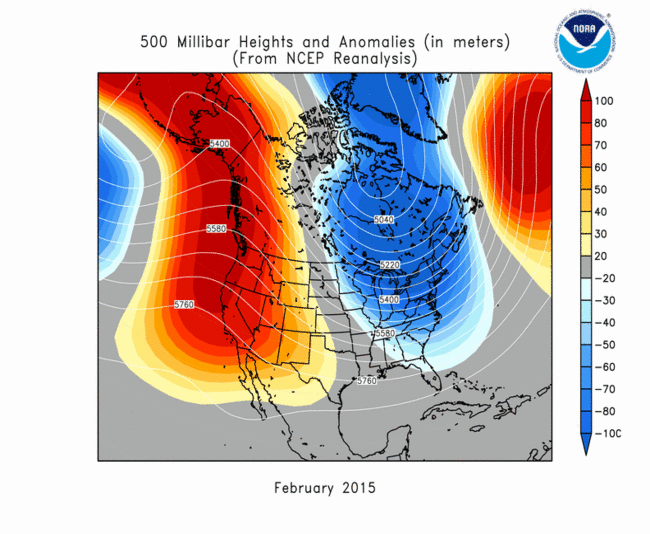
Maps of 500-mb heights (meters; white lines) and anomalies (meters; shaded) for January 2015 (top) and February 2015 (bottom). Maps courtesy NOAA/National Climactic Data Center.
The maps above depict an upper-level pattern in strong agreement with the surface temperature anomalies depicted earlier: An upper-level ridge in the west was associated with warm air near the surface in this region, while an upper-level trough was located over the Midwest and East Coast, providing colder than average temperatures to these parts of the country.
Furthermore, regions downstream (generally east) of upper-level ridges and upstream (generally west) of upper-level troughs are regions of convergence aloft. This allows air to “pile up,” and increases the weight of the atmosphere, and hence the surface pressure, in these locations.
Thus, as expected, we see a relatively persistent area of surface high pressure over the Great Plains and area of low pressure near the New England Coast (Hello Boston!) given these upper-air patterns. The clockwise flow around high pressure systems in the Northern Hemisphere reinforces the chilly air from Canada over the Northeast and Midwest.
More importantly for tornadoes, this same flow pattern yields cold, dry, offshore flow in the Gulf Coast region, effectively prohibiting the transport of warm, moist, unstable air from the Gulf of Mexico or Caribbean Sea into the southern United States. The next time you see a long-range forecast advertising a pattern such as this, don’t be surprised if there are fewer than average tornadoes during that period if the forecast verifies!
Of course, climate averages do not create severe weather events, but individual weather systems do. An animation of the daily surface weather maps for the month of February can be found below.
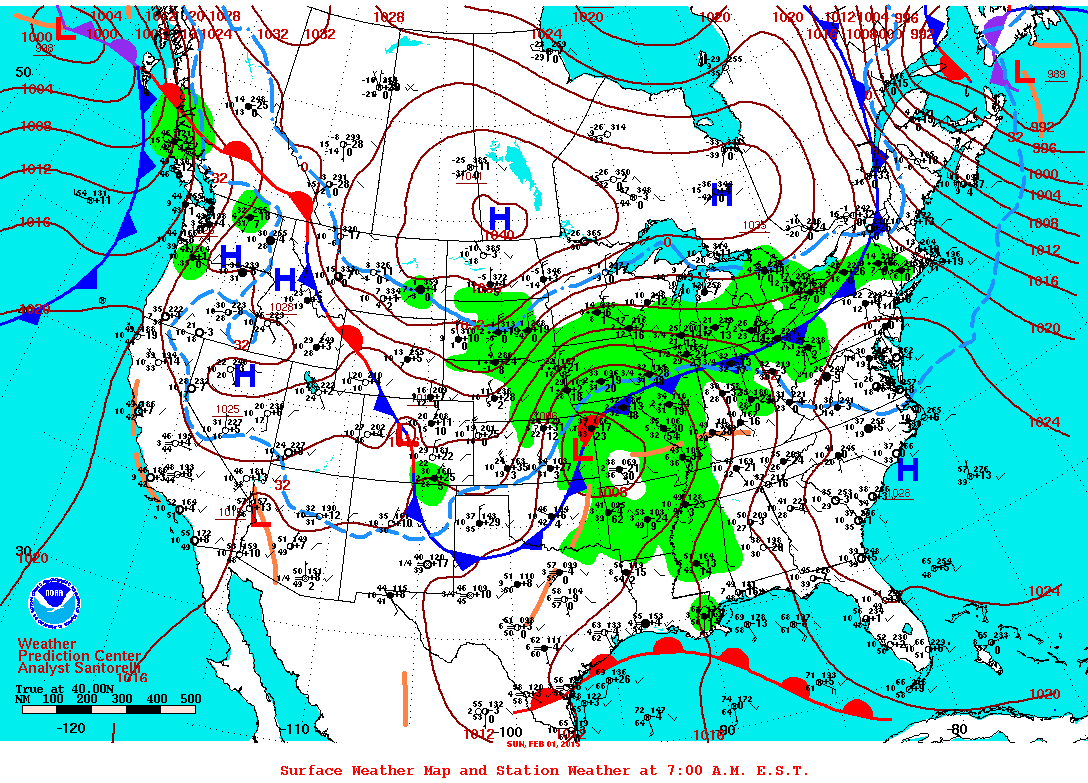 Daily surface weather maps valid at 1200 UTC (7am EST) for February 2015. Green shading represents precipitation (rain or snow). Courtesy NOAA/National Climatic Data Center.
This animation above depicts the nearly constant introduction of Arctic high pressure centers from central Canada into the Central and Eastern United States and ultimately the Gulf of Mexico. It was the persistence of this pattern throughout February that led to the prolonged tornado drought during the month.
So what does this mean for March?
The first week of March saw the same pattern that dominated throughout February – cold in the East and warm in the west. Although this pattern broke down during the second week of the month, the lack of a strong surface cyclone did not permit either strong low-level wind shear or the transport of moist and unstable air into the Southern United States, both of which are crucial ingredients for tornadoes.
Off-site related: March 1-15 tornado history | Quiet in a month with big outbreak potential
A look at the medium-range numerical weather prediction models reveals that another cold Canadian high pressure center is forecast to build into the Central and Eastern United States in the coming days, with the familiar upper-level trough in the east, ridge in the west pattern continuing through the third week of the month.
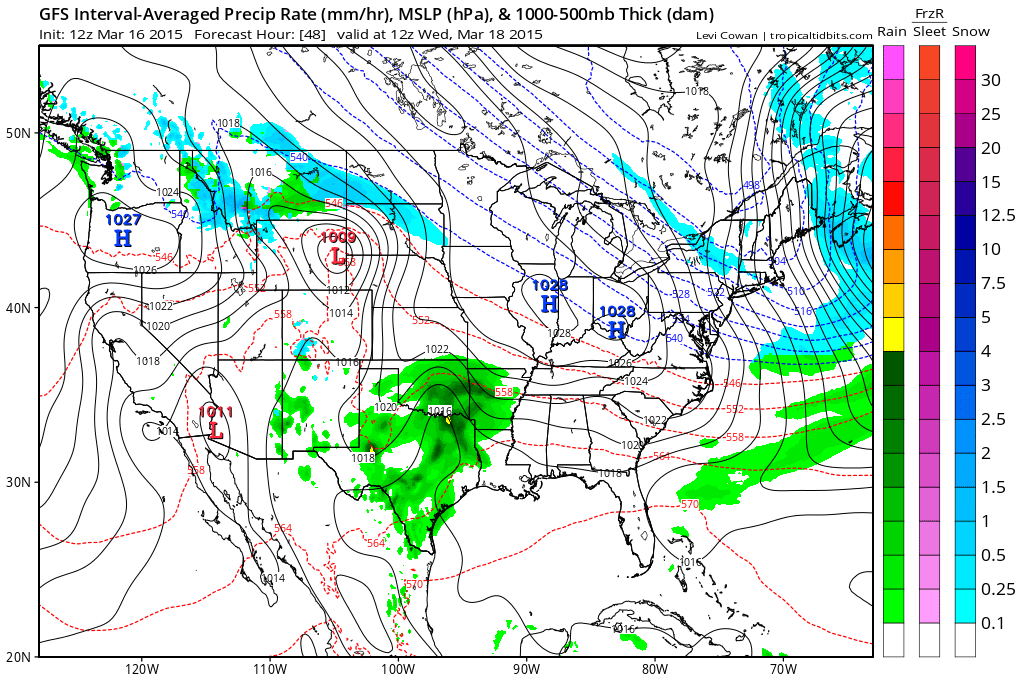

Maps depicting sea-level pressure (mb; solid contours), 1000-500 mb thickness (meters; colored dashed contours) and precipitation (shaded) from the GFS model at 1200 UTC (8:00 am EDT) March 18, 2015 (top), and 500-mb heights (Dm; contours) and height anomaly (Dm; shaded) at 0600 UTC (2:00 am EDT) March 22, 2015 (bottom). Images courtesy tropicaltidbits.com.
Individual weather systems that might cause tornadoes become less predictable after about seven days or so, but there is still utility in examining ensemble mean predictions as well as other larger-scale atmospheric and oceanic circulations such as the El Nino Southern Oscillation (ENSO). The numerical weather prediction models indicate that thunderstorms may be possible over portions of the Plains and South around March 23-26 or so, although I have doubts about the quality of the low-level moisture return ahead of this system that may mitigate any tornado potential.
NOAA recently declared that a weak El Nino has developed in the Eastern Pacific Ocean. Recent research published in the journal Nature Geoscience by Allen et al. (2015) indicates that El Nino conditions result in fewer tornadoes during the spring months on average as shown below.
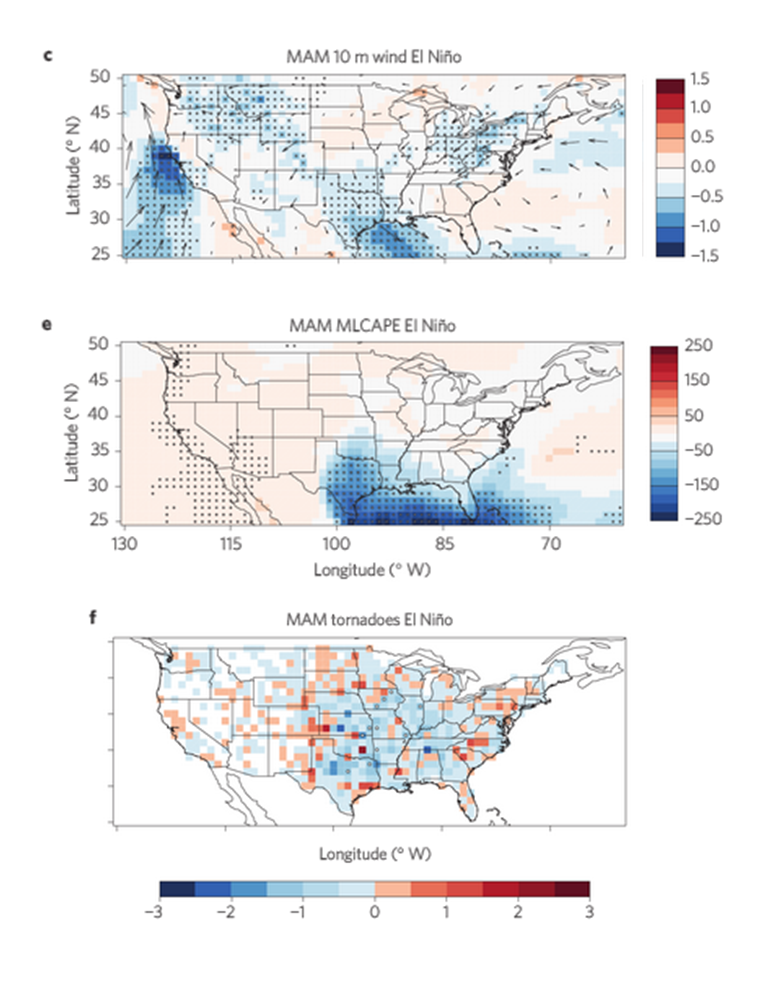
Plot showing 10-m wind anomalies (m/s; top), mixed-layer convective available potential energy (CAPE – instability; J/kg; middle) and number of tornadoes (bottom) during the months of March-May for El Nino years. Image source.
These images indicate that, during El Nino springs, stronger than average offshore winds over the Texas Gulf Coast transport dry continental air masses into the Gulf of Mexico (top). The introduction of cool and dry air masses into this region reduces instability (middle) and results in fewer tornado reports (bottom).
Although not all El Nino years can be treated equally, these results are consistent with the spring outlook issued here on March 2, in which a below average tornado count was forecast as a the most likely outcome (50%) for the spring months.
Despite continuing with a below average forecast, tornado numbers will not continue to hover near zero going forward as the eventual seasonal influx of warm, moist, unstable air into the United States will promote the development of thunderstorms, at least a few of which will produce tornadoes.
Thanks for your detailed analysis. Love to get your thoughts on regional probability and timelines for the upcoming chase season on the plains.
In “normal” years severe weather generally starts up in March on the plains and drifts northward as the season progresses with it peaking in May. If 2015 follows the past 2 seasons and considering the conditions noted in your article, what is your educated guess for the following:
1. Chase season: no change from last year vs. begins later in 2015
2. Regional bias: severe weather (e.g. Northern plains vs. Southern plains)
3. Probability: Highest probability for tornadoes in region X during the month of __? (e.g. Nebraska during June)
Obviously an educated guess using past and immediate data is subject to invalidation by unforeseen future developments, but as we eagerly formulate plans for this season, it would be helpful to get your two cents on the above. Also more fun to look back on predictions and see how we did.
Would appreciate any thoughts you have on the above.
Have a nice day 🙂