On August 24, 2016, numerous tornadoes scoured the landscape across central Indiana and into northwest Ohio. What made the outbreak notable is not only the time of year — tornado outbreaks are unusual in late August — but also that the outbreak caught many meteorologists off guard. In this post, we’ll walk through some of the meteorological factors that led to this unexpected event, look at why the forecast missed, and think about what we can take away from it all.
This event will likely go down as one of the largest tornado outbreaks during the month of August since modern records began. The daily record is 40 tornadoes associated with Hurricane Katrina on August 29, 2005. The largest non-tropical cyclone-induced outbreak on record in August is 30 tornadoes, which occurred over the Midwest on August 29, 2009.
A radar loop of the event reveals an unusual evolution.
At the beginning of the loop, a morning line of storms can be seen moving from eastern Illinois into Indiana before dissipating. A second, more impressive, line of storms developed over eastern Illinois later in the morning. As this line moved into Indiana during the early afternoon hours, it broke into discrete supercells (supercells are rotating thunderstorms that produce the majority of violent tornadoes).
While this evolution is certainly unusual, it is hardly unprecedented, although the author is not aware of any scientific studies of such a transition. It is much more common to see individual supercells form into a line of storms as the “cold pools” of chilled outflow winds from the storms coalesce and become the dominant lifting mechanism (rising air is required for thunderstorm formation and maintenance).
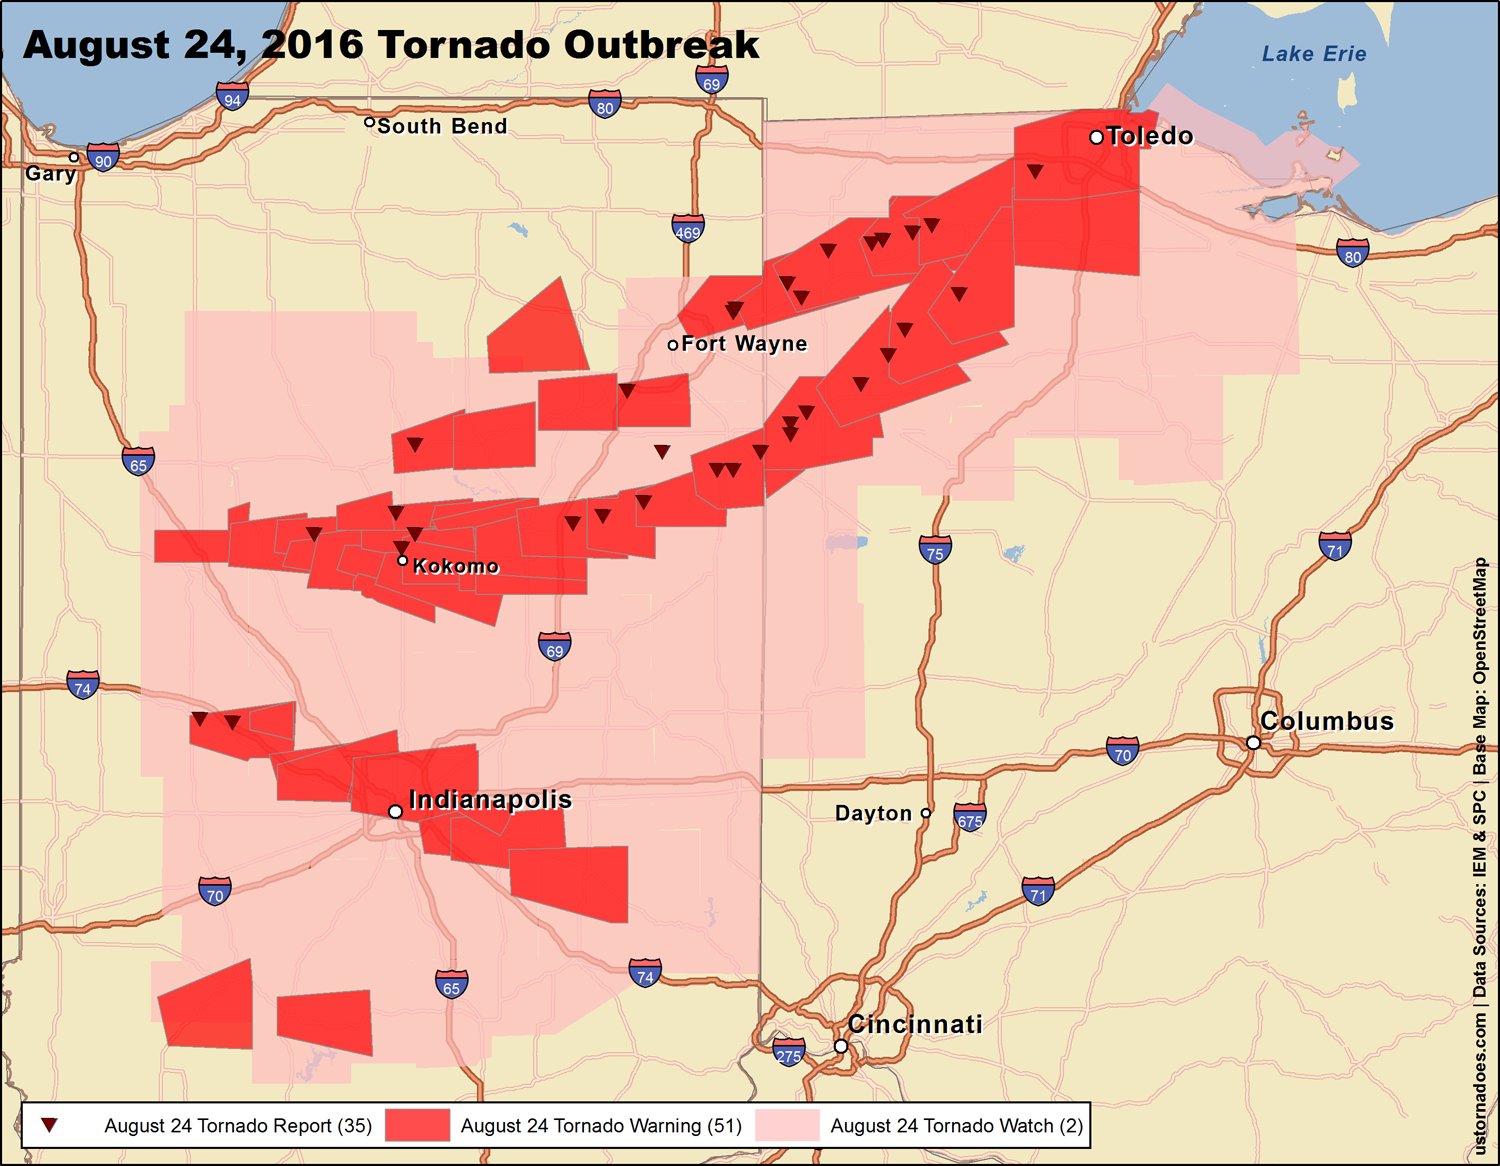
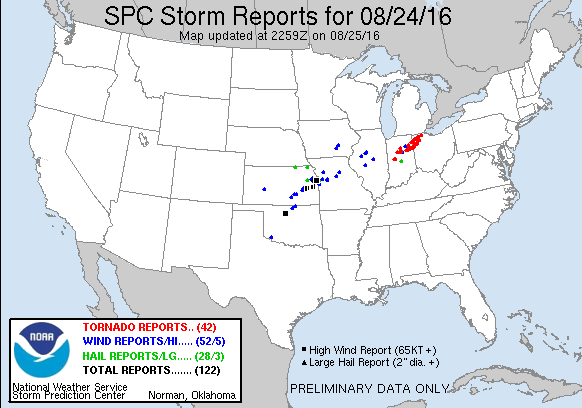
These initial supercells were the most prolific tornado producers – with the southernmost storm producing the first tornadoes west of Indianapolis and eventually prompting tornado warnings for the city itself. A second supercell quickly developed north of the city and produced a tornado in Kokomo, Indiana; this storm became a cyclic tornado producer as it crossed south of Fort Wayne and into adjacent areas of northwestern Ohio. A third supercell evolved even farther north, producing tornadoes near Fort Wayne, and tracked along the US-24 corridor into Ohio, producing tornadoes as far northeast as the southwestern suburbs of Toledo (see map above).
Additional supercells developed behind these initial tornado producers during the midafternoon hours, and continued to produce tornadoes north of Indianapolis into the evening. Another lone supercell even produced a hefty tornado near Windsor, Ontario!
Particularly hard hit was Howard County, Indiana, where Kokomo is located. As many as four different supercells prompted tornado warnings Wednesday afternoon and evening in this area.
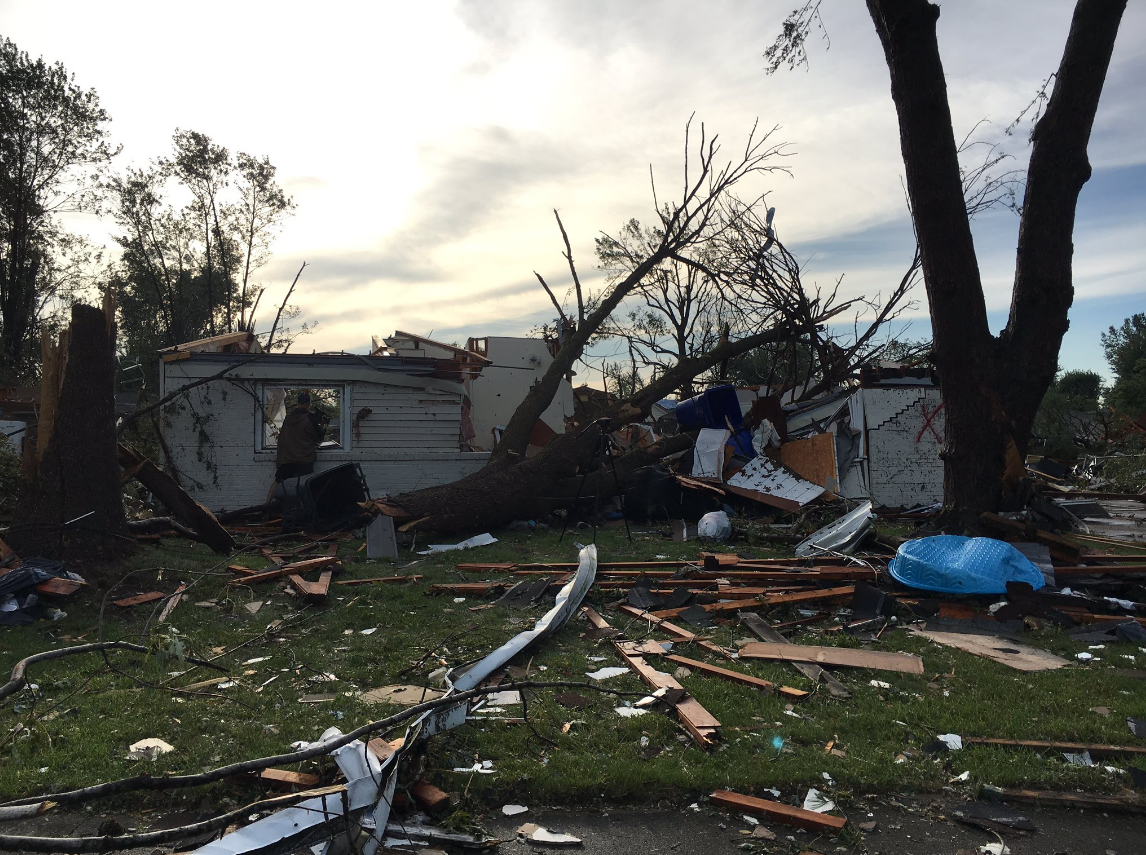
As of publish time, the initial Kokomo tornado has already been assigned a rating of EF-3 by the National Weather Service in Indianapolis.
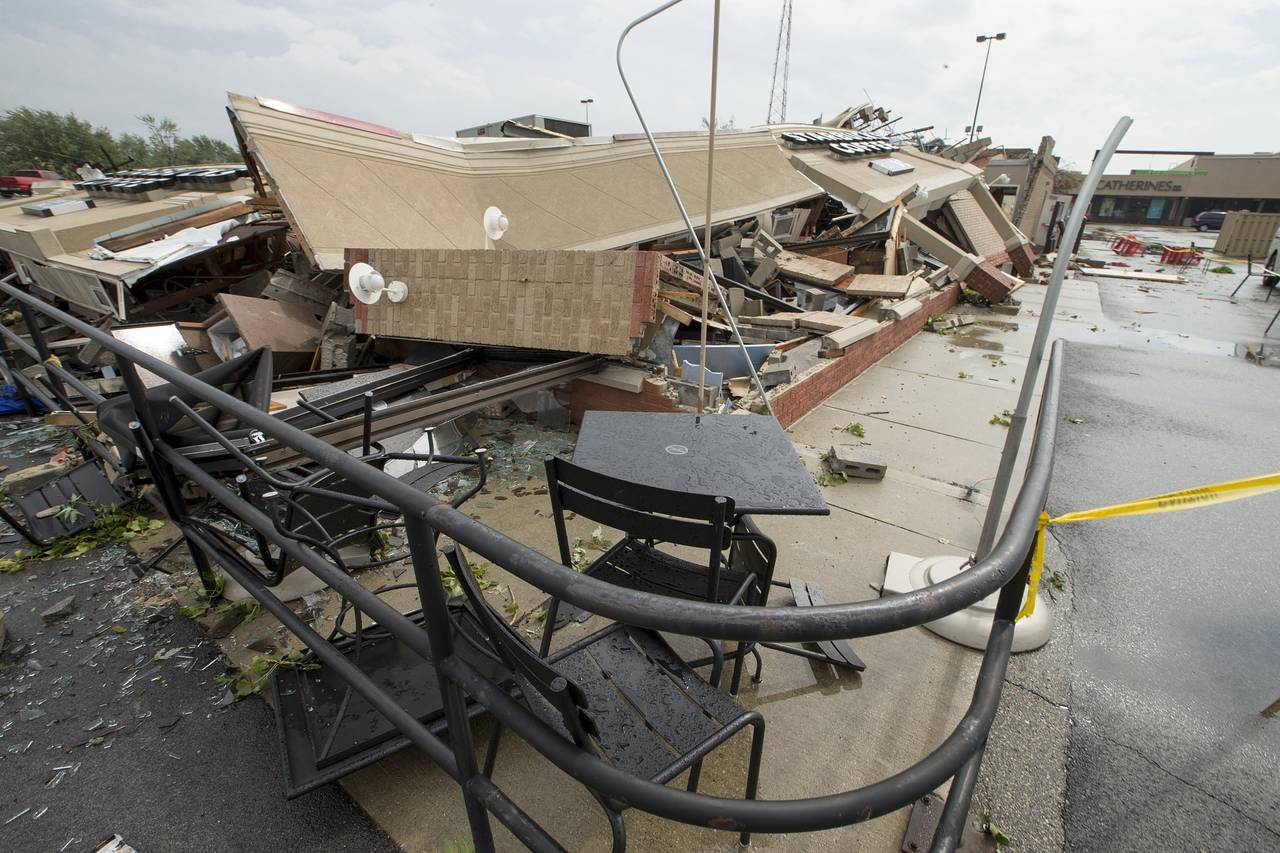
This was also the tornado that destroyed a Starbucks in Kokomo, although the fact that surrounding structures, including nearby buildings, power poles, and even the Starbucks sign, only suffered light damage led many to question the integrity of the structure. Widespread damage occurred elsewhere in the town, however.
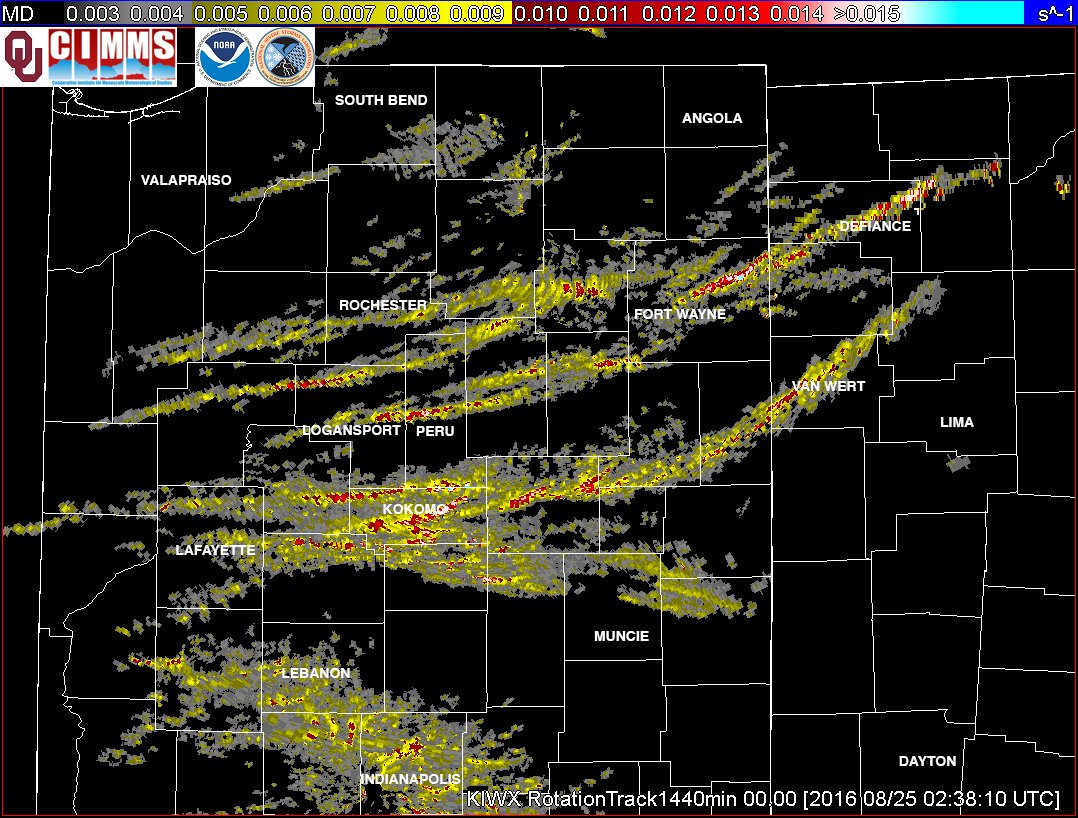
Many of the tornadoes that occurred Wednesday were large tornadoes, and several debris balls were noted on dual-polarization radar. This begs the question: How can such a regional tornado outbreak go relatively unforecast in the year 2016?
To try to get an answer to that, we must examine the meteorology that contributed to the outbreak.
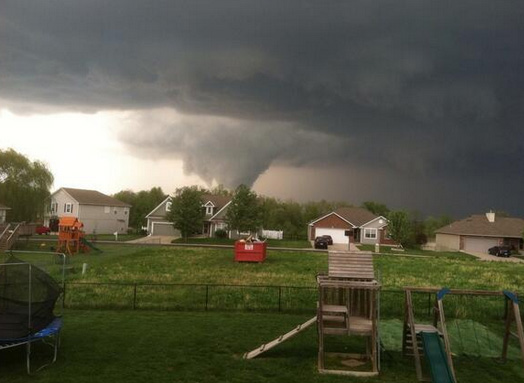
~10 min ago looking north from just west of Sharpsville #INwx pic.twitter.com/PaJzftuFwk
— Daniel T. Dawson II (@Meteodan) August 24, 2016
Tornado outbreaks do not occur if all of the ingredients for them are not present.
These ingredients include an unstable atmosphere, high surface relative humidity (manifested in low cloud bases), strong vertical wind shear (change in speed or direction with altitude that allows for storm rotation and is manifested in high values of a quantity called storm-relative helicity, or SRH), and a lifting mechanism to initiate storms.
A post-analysis of the August 24 tornado outbreak reveals ample instability and SRH across Indiana and northwestern Ohio at the time of the tornadoes (not shown), while a surface map depicts a subtle wind shift (from south to southwest winds) over western portions of the state, which was likely instrumental in triggering the second round of tornadic supercells. Recall that the first round evolved from a line of storms that moved from Illinois into Indiana. With temperatures in the lower 80s and dewpoints in the middle 70s, surface relative humidity values were also more than sufficient for tornadoes.
The vertical wind shear over Indiana and Ohio was further enhanced by a larger-scale counter-clockwise circulation over northern Illinois, that was a couple hundred miles across, as seen in the satellite loop below. This circulation developed within a cluster of storms that formed Tuesday evening over Nebraska and Kansas. It eventually moved into Illinois during the early morning hours of Wednesday.
Meteorologists call such features, which are relatively common over the Midwest during the spring and summer months, mesoscale convective vortices, or MCVs for short. These features locally enhance winds in the lower levels of the atmosphere, particularly on their southern and eastern sides, leading to larger values of wind shear and SRH there. Lift is also augmented ahead of the vortex and suppressed behind it, as seen by the enhanced cloudiness ahead of the circulation and generally clear skies behind it.
The exact location and strength of such vortices, however, is often difficult to accurately predict more than 12 hours in advance. This is because their location and intensity is nearly completely dependent on the preexisting thunderstorm clusters that produce them.
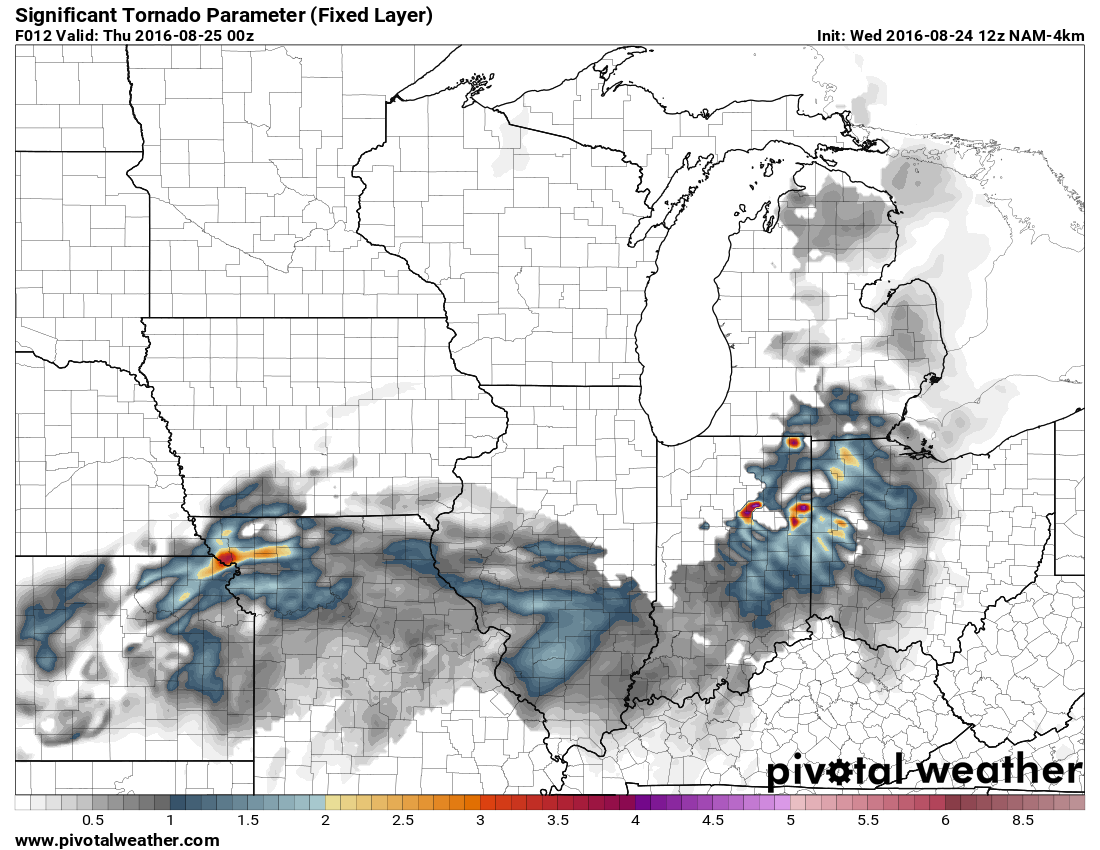
Meteorologists at the Storm Prediction Center have developed the Significant Tornado Parameter (STP), which combines and normalizes each of the ingredients listed above. The index is normalized such that a majority of significant tornadoes (F/EF-2+) have occurred in environments characterized by STP values greater than one, while environments with an STP of less than one usually do not produce significant tornadoes.
Note that this analysis does not imply that a majority of environments with an STP of greater than one have produced significant tornadoes.
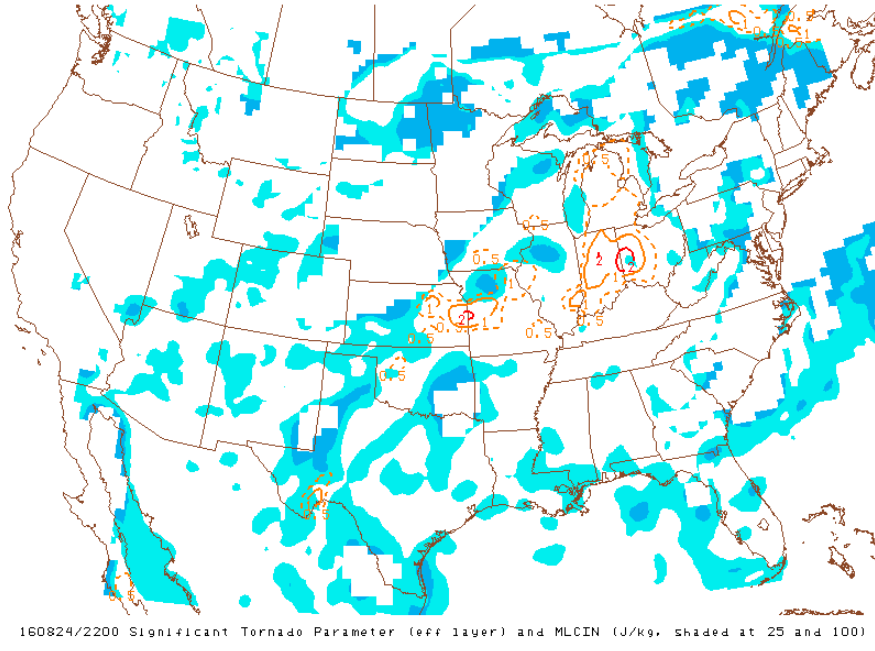
Values of STP over Indiana and adjacent parts of Ohio were between 1 and 3 during the tornado outbreak on August 24. I generally associate values of STP in this range with an environment that may produce tornadoes, and maybe even a significant tornado, but not with an environment that will produce a regional tornado outbreak.
The tornado risk would be maximized if discrete supercells were present in such an environment.
Similar STP values existed along the Kansas-Missouri border south of Kansas City. While there were several reports of high winds and large hail in this region, there were no tornado reports, even though a couple of supercells developed there.
The post-analysis presented above indicates that, knowing what we know now after the fact, tornadoes were certainly possible across Indiana and Ohio on the afternoon of August 24, and that one or two of the tornadoes could be significant, if (and that’s a big if) supercell thunderstorms developed in this environment (which several did).
Other than analyzing the environmental conditions (as done above), forecasters also look at output from a variety of numerical weather prediction (NWP) models of the atmosphere. With this, forecasters hopefully ascertain how an environment will change throughout a day and what types of storms, if any, will develop. Other clues include where and when they are most likely to develop.
Of the NWP output I examined, the model that depicted the best chance of supercells across Indiana on the afternoon of August 24 was the 4-km resolution version of the North American Mesoscale (NAM) model that was initialized at 8 a.m. EDT that morning. As seen below, the model forecast several discrete storms over Indiana at 5 p.m. EDT (below left), STP values generally between 1 and 3 (below middle; note that the patches of high STP values are calculated at grid points within the simulated storms and are thus not representative of the larger-scale environment), and streaks of updraft helicity (UH; which represents simulated rotating updrafts – but not every UH streak is necessarily representative a simulated supercell; below right).
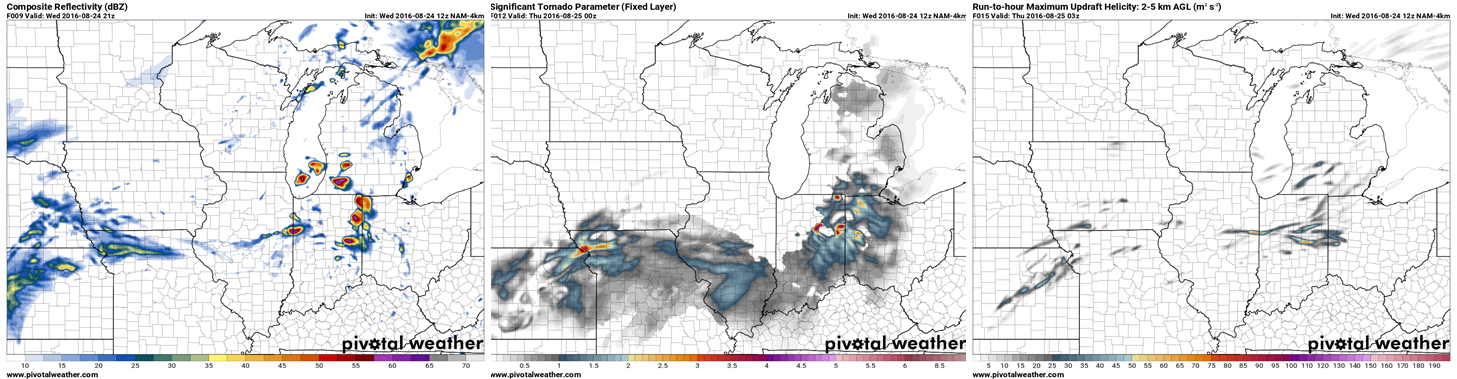
This model, however, completely failed to initialize the precipitation over eastern Illinois that morning (not shown). As a forecaster, I would have personally been very skeptical of a model solution depicting afternoon thunderstorms developing downstream of an area of morning precipitation when that area of morning precipitation was not even present in the model solution.
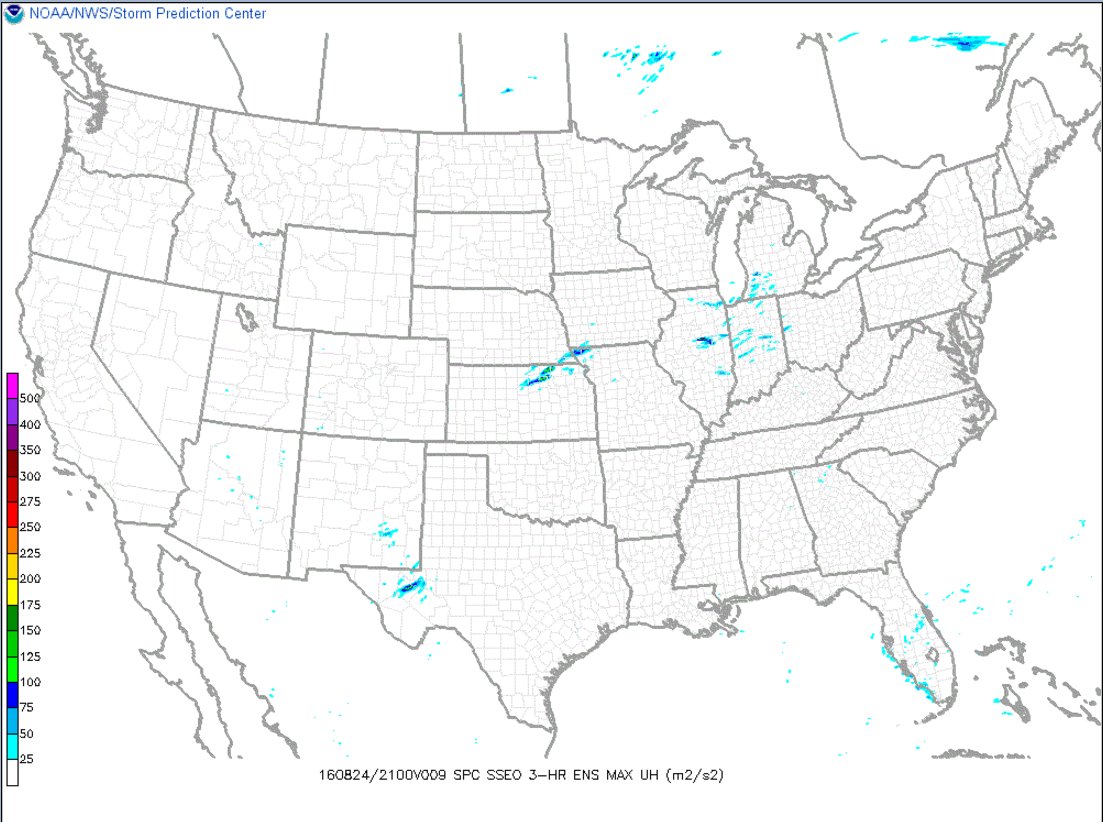
Other high-resolution model output available to forecasters that morning, including the High-Resolution Rapid Refresh (HRRR; run hourly) and the Storm Prediction Center’s Storm Scale Ensemble of Opportunity (SSEO), depicted far less in the way of rotating updrafts than did the 4-km NAM. For example, the SSEO barely had any updraft helicity swaths greater than 50 m2⋅s-2. For non severe weather aficionados, these are values which are hardly suggestive of cyclic tornadic supercells.
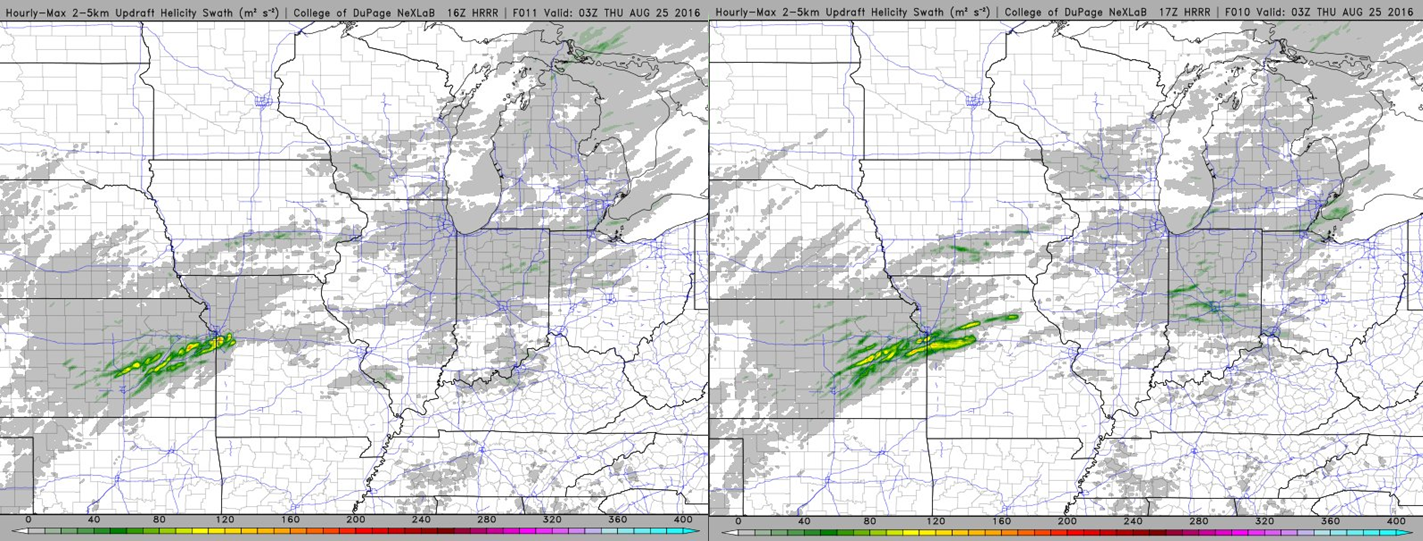
Run after run of the HRRR similarly failed to simulate rotating updrafts across Indiana that afternoon, instead depicting lines of thunderstorms and areas of rain moving eastward from Illinois and continuing across Indiana. The UH produced by these runs was minimal. It wasn’t until the HRRR run that was initialized at 1 p.m. EDT that this model depicted UH across Indiana.
Similar to the other NWP models discussed above, however, values of UH seen on the model are not typically associated with cyclic tornadic supercells. Furthermore, the output from this simulation would have likely arrived just minutes before the National Weather Service in Indianapolis issued the first tornado warning of the day at 2:37pm EDT.
To reiterate, the only NWP output available hours in advance of this event that suggested supercell-like structures over Indiana on the afternoon of August 24 (the 4-km NAM) did not capture the lines of storms moving toward Indiana from Illinois. One of these lines of storms eventually broke into three supercells that produced the first round of tornadoes across the region. A second round of tornadic supercells followed.
Even if the poor model forecasts of storm type are discounted entirely, I personally still would not have forecast a tornado outbreak seeing a line of generally sub-severe storms moving into an environment that might be conducive for a few tornadoes, one or two of which may be strong, since a line of storms, as opposed to discrete supercells, appeared to be the dominant storm type. Please note that this is only my professional opinion, and that I have not discussed this with anyone responsible for issuing forecasts on that day.
As is clear from the map above, this was not a good forecast. SPC outlined Indiana and Ohio in a categorical Marginal Risk with a less than 2% chance of a tornado within 25 miles of a point; the outlook was largely unchanged when updated at 12:30 p.m. EDT. Eventually, there were nearly three dozen tornado reports within a relatively small area.
One can split hairs as to whether one would have thrown out a token 2% contour over Indiana and surrounding regions, but that is beside the point. In a perfect world, tornado outbreaks should not occur in 2% risk areas either. As I try to step into the shoes of the forecasters that morning, I find it difficult to build the rationale for calling for a tornado outbreak until after the first warnings started flying that afternoon.
In fact, the first mention I saw of a tornado came in a tweet from WTHR-TV meteorologist Sean Ash, just before 2 p.m. EDT. This proved to be an excellent forecast based on an analysis of current conditions, but occurred hours after the SPC morning outlook was issued.
So what are the key takeaways from this event?
- The NWP models obviously did not have a good handle on the evolution of this event. While NWP models have become increasingly skillful over the last decade, they still can struggle, especially in marginal cases. Continued advances in NWP will only lead to better forecasts.
- Even a perfect NWP model is only as good as its observational input. Increased or more frequent weather balloon launches may have resulted in better NWP forecasts and/or more accurate analyses of the current conditions by forecasters, although the only way to determine this for sure is to rerun the models with these added data.
- Discount environments exhibiting good SRH and deep-layer vertical wind shear within a summertime warm sector at your own peril.
- Continuing research on how thunderstorms transition between types, particularly from line segments to supercells as was the case here, is required for the community’s conceptual understanding of such scenarios.
In closing, we would like to recognize all of the hardworking men and women at the National Weather Service Forecast Offices in Indianapolis and North Webster, Indiana, and in Cleveland, Ohio, who delivered accurate and timely warnings. The same goes to all of the private sector meteorologists who warned their clients as well as all of the broadcast meteorologists and others who disseminated these warnings. These folks likely saved countless lives and prevented many more injuries.
That there were no serious injuries or fatalities reported as of this writing — despite the surprise nature of this outbreak — is truly the most pleasant surprise of all.
Great summary and explanation by one of my favorite meteorology professors!!
One of my favorite cases of a line transitioning into several discrete supercells was the North Carolina tornado outbreak on April 16, 2011. Watching the radar archives for that event is pretty amazing.
The April 16, 2011 tornado outbreak in NC behaved in a similar manner, i.e. a linear MCS /squall line/ evolved into several discrete tornadic supercells as it progressed into an increasingly favorable thermodynamic/kinematic environment in the presence of strong synoptic forcing and moderatel instability (1000 to 1500 J/kg). In that case, the MCS approaching from the west had yet to mature and no MCV was present. A case summary of that event can be found at: http://www4.ncsu.edu/~nwsfo/storage/cases/20110416/
The big difference was that the day before the 4/16/11 outbreak and especially the morning of, there was an almost unanimous consensus between the global, regional, and high resolution models of a higher end event. The NAM especially was tripping sig tor values in the 4-7 range. The directional and speed shear were off the charts that day and well forecast in advance of the event. I think the big difference in forecast skill with the models was the scale of forcing. It was a much more synoptically driven event than the one that took place a couple of days ago. Also, for that time of year in North Carolina, 1000-1500 J/kg mixed layer CAPE is fairly significant when you are putting it on top of 500 m2/s2 0-1km helicity.
The April 16, 2011 event was the first time I’d seen an MCS evolve into discrete supercells. As you mentioned it’s almost always the other way around, i.e. discrete supercells growing upstream and evolving into an MCS. In that case, SPC nailed the forecast with a Day 2 moderate risk and a rare Day 1 High risk for the Carolinas. Around 30 tornadoes occurred that day (see the following tornado track analysis)
http://www4.ncsu.edu/~nwsfo/storage/cases/20110416/20110416.tornado.gif
-Brandon V.
I think the author should have added the importance of the role that initial condition error plays in all forecasts, and how errant ICs in many of the short term models for this day may have been responsible for the poor forecasts. I would also have liked to see discussion on the uncertainty of the event using probabilistic/ensemble forecasts, as this type of forecasting is being developed rapidly within the research community, and there are existing experimental convection-allowing ensembles that go beyond what the SSEO does and may have pointed towards this being a low-predictability event. Just because operational peoples’ favorite deterministic model doesn’t predict an event doesn’t mean the event was a huge bust across the entire forecast community. Some events are simply inherently less predictable than others. This may have been one of them. I suspect it was based on the presence of the MCV.
Along those lines, the convective mode was obviously quite important with one maybe subtle detail. A broken line of supercells is a worst-case scenario and characteristic of many tornado outbreaks (go back to Barneveld, WI in 1984 for just one of many examples). So the model challenge is to develop this linear system, then break it down into many supercells rather than maintaining a QLCS or transitioning to just a few supercells.
I don’t think the evolution and impact of MCVs are an entirely understood phenomena yet either regardless of model performance. Makes me wonder if we should conduct more special soundings when upper-air observation sites are located in/near an MCV.
And despite all of these issues, kudos to the WFOs whose warnings were quite excellent despite not having days of anticipation and hype prior to the event. Just because the event was not “forecast” does not mean the event was a bust. Ultimately for what matters (saving lives), it was a huge success.
Shear is the key. First, the convective line must be in balance with its outflow. In other words, in a Lagrangian sense, the outflow doesn’t run away from the linear updrafts. Second, a kick in the effective low level shear is needed. In the 26 April ’84 case in central OK, the nocturnal LLJ kicked in with 60+ kts at 850 hPa, changing the shape of the hodograph dramatically. Whatever the cause, the effective hodograph (helicity) must increase. QLCS features will follow, but as the cold pool interfaces folds back on themselves, updrafts (always rotating!) sucking on these localized areas will tilt and stretch this helicity-rich air. By this time the linear structures will change to supercellular as cold pool structures adapt to these low-level pressure perturbations, and provided the FF downdraft interface wraps parcels confined on their (nearly) moist isentropes back around to help a RFD form and bingo.
My $1.27, adjusted for inflation and monetization of the national debt 😀.
Amazing insight, technical skill and data analysis. I couldn’t stop reading end to end. Do you post to your site on a regular basis? Do you communicate with chasers? I am an amateur chaser that lives in Ca who is very technical. Due to my distance from tornado alley, I need to forecast torcon probability 4 to 6 days in advance. Can you help? Normally I look at the April 20 to may 20 forecast for kansas and Oklahoma and that’s it…just play the numbers. However I did call the June 12 to 16 conditions correctly. For sept, 7 thru 10, I notice an unusually deep north south cold front forecast to move into the central plains into 70 degree dew points and warm temps. I realize there are a lot of undetermined variables, but do you have any opinions about a potential outbreak?
Thanks,
Dale
Dry line chaser
Grate and detailed discussion I’ve learned alot of new metrology terms