
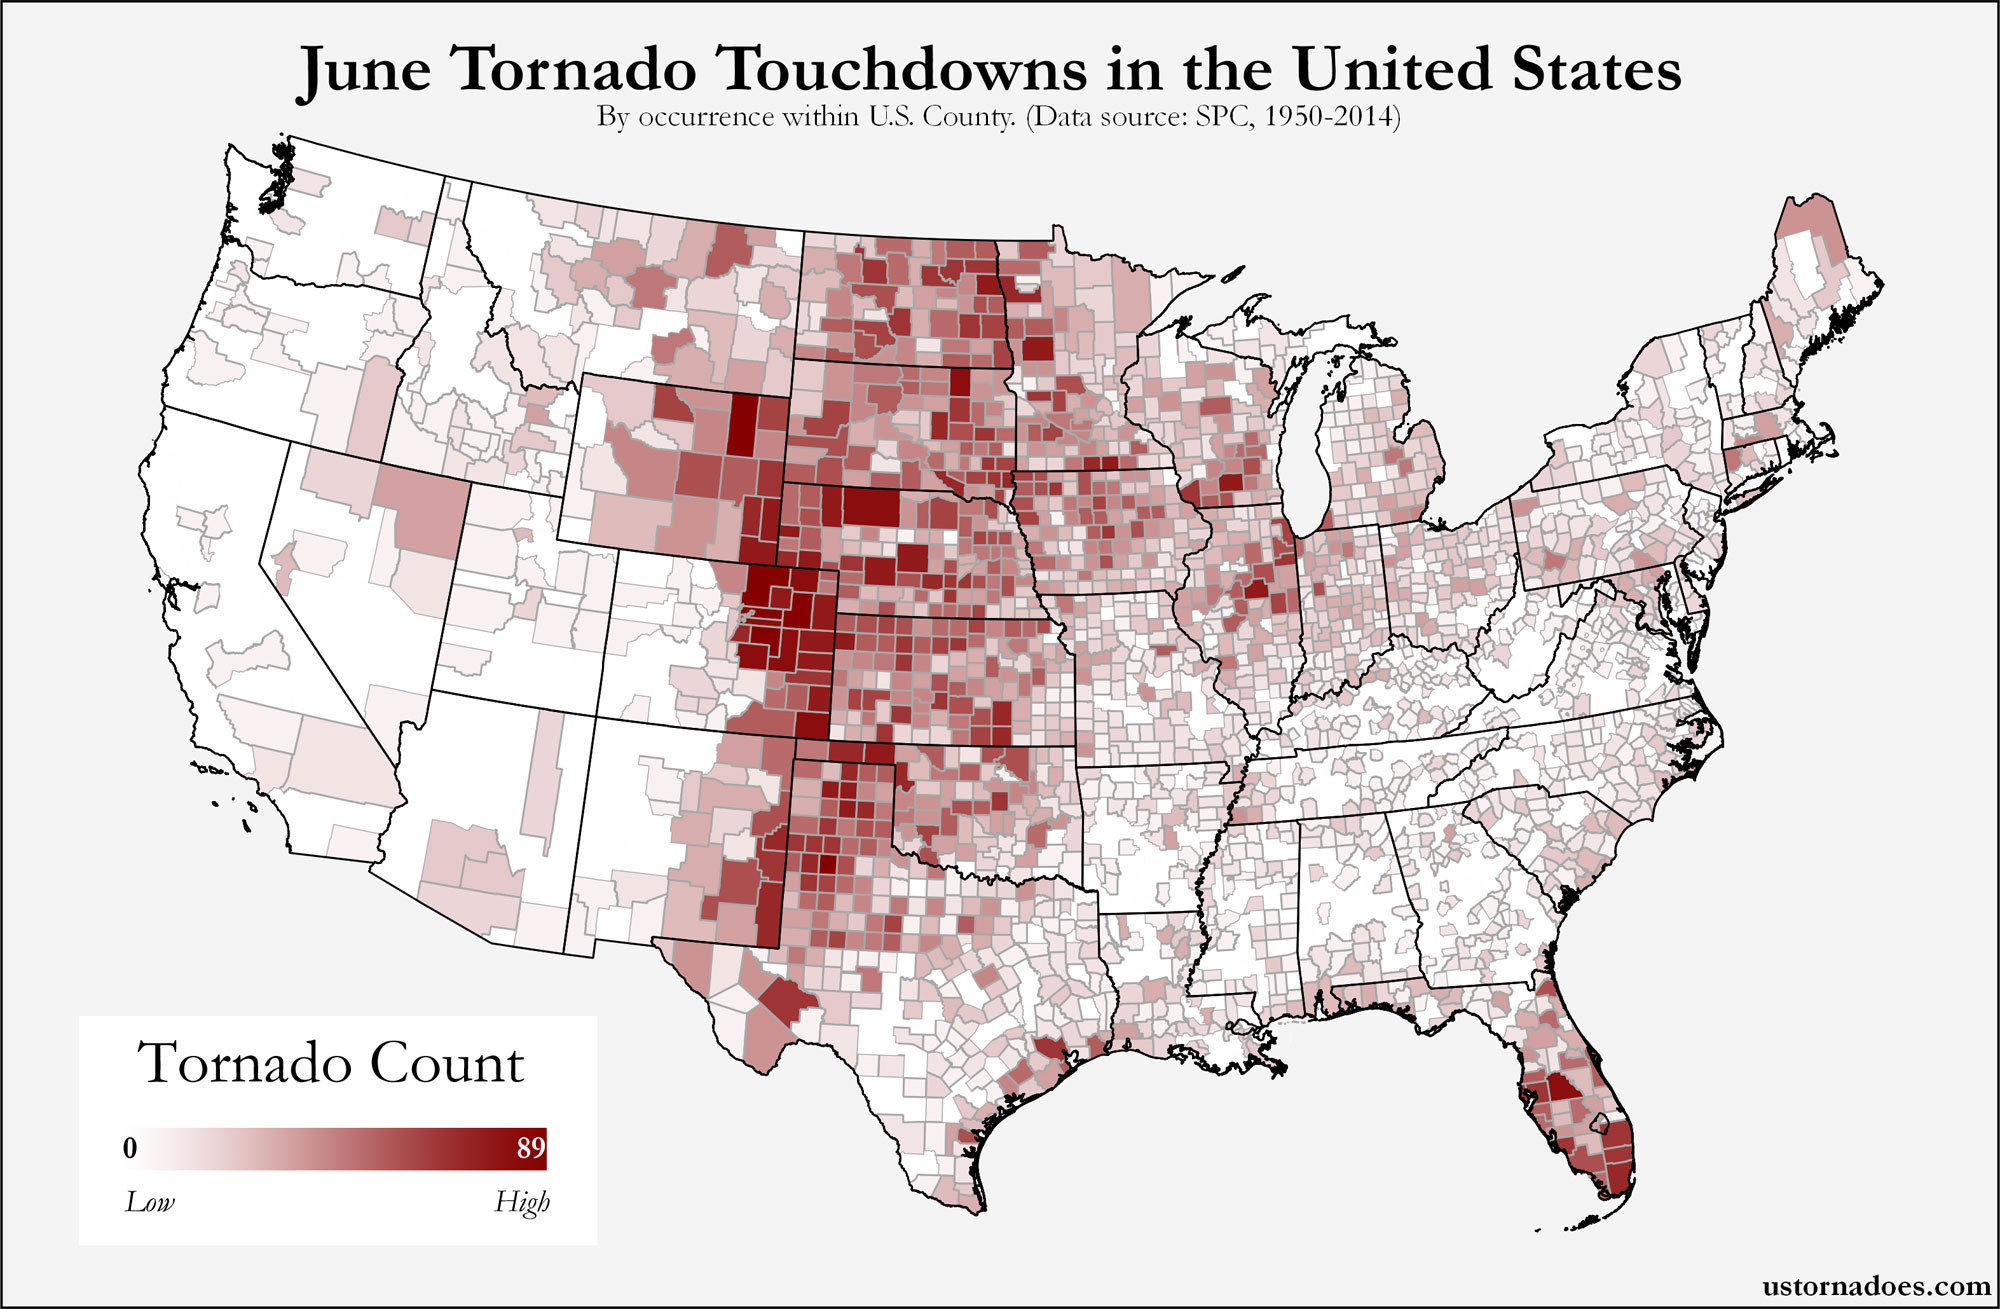
I recently posted graphs showing the raw totals of tornadoes both by month and by day. They indicated a monthly peak in May and a daily peak from May into June. While full tornado numbers by day do show at least the general climatology of the overall historical period (currently 1950-2010), it is skewed — sometimes quite noticeably — by larger outbreaks.
A next step in the seasonal or yearly tornado climatology game is to take a look at tornado days. A tornado day is any day which has a tornado in the United States, whether one or 50.

From 1991-2010, the averaging period currently used by NCDC, there were eight calendar days that saw a tornado touch down in the United States in all 20 years. All of them were in June, and all were squeezed into the period bounded by the 4th and the 27th. When it comes to years that missed just once on any calendar day throughout the 20 years, the range opens, covering May 23 through July 14.
U.S. tornado days peaked in June during the period, with 91.7 percent of all days in the month having a tornado touch down. When rounded to the nearest full digit, both May and July came in with 84 percent of days containing at least one touchdown of a tornado. At the other end of the scale, December failed to crack 20 percent of days having a tornado, and January just barely did so.

The graph of the whole year, by month, is a pretty standard curve, though the increase in tornadoes in the spring is quicker than the fall off into the winter. Examinations of earlier periods and significant tornadoes showed a quicker drop-off in the summer than this sample of all tornadoes, and that will be addressed in more depth here at some point in the near future.

Breaking the period down into two ten-year segments, we see a good deal more days with tornadoes during the 1991-2000 period compared to the 2001-2010 period. The former had 1,928 tornado days while the latter had 1,738. For one quick comparative look, 1991-2000 had 37 calendar days which had a reported tornado touchdown in all ten years, while 2001-2010 had 16.

When it comes to tornado days by year, there is an overall sense of consistency, if also an observed trend slightly downward over time during the 1991-2010 period. The ten-year average for 1991-2010 was 193 tornado days per year, and it was 174 days for 2001-2010, with an overall 20-year average of 184 days.
This is a brief examination of an ongoing analysis. It will eventually cover the entire modern historical record back to 1950, as well as include data on significant (or strong) F2/EF-2+ tornadoes. 2011 data on each tornado is not yet available to the public and has been unmentioned because of that. This post will be amended to at least note it once it is available.
All images can be viewed larger by selecting. SPC tornado data obtained through the Tornado History Project. Get updates on U.S. Tornadoes on Twitter and Facebook.
Latest posts by Ian Livingston (see all)
- Tornado outbreaks: April, May and June peak-season primer - April 27, 2025
- Busy March for twisters to end with another multi-day event - March 28, 2025
- Everything but locusts: NWS shines in apocalyptic weather - March 17, 2025
Hi!
This is really interesting what you have above, and a colleague pointed me in this direction as we have been doing some related research.
Donald Turcotte and myself worked on tornado statistics this last summer, including a section on USA ‘daily tornado outbreaks’ which, following some other authors, we defined as the number of USA tornadoes in a days, similar to what you have done above. However, we only considered those tornadoes with path lengths greater than 10 km (‘severe’ tornadoes), so that the data might be more consistent from one decade to another.
We submitted a manuscript on this to Atmospheric Chemistry & Physics. The manuscript is in its discussion phase (so people can comment on it, and we would certainly be interested in comments to improve the manuscript) at http://tinyurl.com/TornadoPaper. Harold Brooks has already provided a nice review, with one more review yet to come.
The abstract of the discussion-phase manuscript is:
“Statistics of severe tornadoes and severe tornado outbreaks”
B. D. Malamud (1) and D. L. Turcotte (2)
(1) Department of Geography, King’s College London, UK
(2) Department of Geology, University of California, Davis, CA USA
Abstract. The standard measures of the intensity of a tornado in the USA and many other countries are the Fujita and Enhanced Fujita scales. These scales are based on the damage that a tornado causes. Another measure of the strength of a tornado is its path length of touchdown, L. In this study we consider 4061 severe tornadoes (defined as L ≥ 10 km) in the continental USA for the time period 1981–2010 (USA Storm Prediction Center Severe Weather Database). We find for individual severe tornadoes: (i) The noncumulative frequency-length statistics of severe tornado touchdown path lengths, 20 < L < 200 km, is well approximated by an inverse power-law relationship with exponent near 3. (ii) There is a strong linear scaling between the number of severe tornadoes in a year and their total path lengths in that year. We then take the total path length of severe tornadoes in a day, LD, as a measure of the strength of a 24-hour USA tornado outbreak. We find that: (i) On average, the number of days per year with at least one continental USA severe tornado (path length L ≥ 10 km) has increased 16% in the 30-year period 1981–2010. (ii) The daily numbers of severe tornadoes in a USA outbreak have a strong power-law relationship (exponent 0.87) on their daily total path lengths, LD, over the range 20 < LD < 1000 km dy−1. (iii) The noncumulative frequency-length statistics of tornado outbreaks, 10 < LD < 1000 km dy−1, is well approximated by an inverse power-law relationship with exponent near 1.7. We believe that our robust scaling results provide evidence that touchdown path lengths can be used as quantitative measures of the systematic properties of severe tornadoes and severe tornado outbreaks.