Tornadoes have been documented throughout American history, but the modern database has a much shorter record. It’s only back to 1950 that we have regular data, and even the early part of this history is highly incomplete.
Partly built from cobbled-together news accounts and the subjective ratings that come with them, the tornado record is fraught with issues, but it also tells a bunch of stories. There are continued efforts to better judge tornado ferocity as well. Plus, let’s cut to the chase: any record is better than no record.
The stories of the tornado database follow a timeline of how tornadoes have been better observed as we near the present day. In addition to the maps for each year at bottom, let’s take a brief walk through the history in which the modern tornado record has resided, from 1950 to here.
In the 1950s there was a practical use of numerical weather prediction and development of computers. Forecasts were done by hand, on printed weather maps. By the 1960s, numerical weather prediction by computer began. The first successful weather satellite was launched, TIROS-7. On a 78-day mission, it relayed thousands of images showing large-scale cloud regimes, thus proving that satellites can provide useful information and surveillance of global weather from space. This satellite paved the way for the Nimbus Program, a NASA and NOAA collaboration for decades that advanced further research and use of satellite programs.
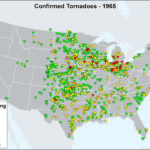
During the first 20 years of the database, tornado reports steadily grew as awareness grew. The Palm Sunday outbreak in 1965 has been attributed to some of the growth in awareness. Forty-seven tornadoes occurred on April 11th and 12th in Indiana, Michigan, Ohio, Wisconsin, Iowa and Illinois. They killed 271. In many ways, it was a generational tornado outbreak like 2011 despite its lower death toll. History is replete with big tornado events that bring discussion of their destructive force out of hiding.
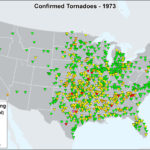
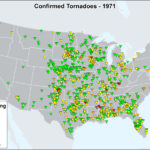
In 1971, the Fujita scale was implemented. It was based primarily on the damage tornadoes caused to man-made structures and vegetation. Prior to F-Scale, tornadoes were rated based on newspaper and eyewitness accounts, including questionable personal accounts, rather than Storm Data descriptions. Tornadoes prior to 1971 were rated retroactively. In 1973, the Fujita scale was modified to take into account a tornado’s path length and width when classifying a tornado’s intensity.
The Mid-1970s also featured the first GOES satellite, which was launched into orbit in October of 1975. It was primarily used to aid in hurricane tracking, but with time has been integrated into severe weather forecasting. Also in 1975, the Tornado Intercept Project began, led by the National Severe Storms Laboratory’s Bob Davies-Jones.
Growth in the general interest of weather brought us The Weather Channel. In May of 1982 it began broadcasting around the clock, and provided more information during severe weather outbreaks.
In 1988, the WSR-88D (NEXRAD) Doppler radar system was given a green light for production. The installation of the first operational prototype was completed in the fall of 1990 in Norman, Oklahoma, while its first operational use in everyday forecasting occurred in 1992 in Sterling, Virginia.
This system is a network of 159 high-resolution S-band Doppler weather radars. The revolutionary radar can properly visualize precipitation and wind. Tornado counts significantly increased following this advancement in technology, as radar was now able to detect when and where strong winds occurred without eyewitness accounts.
Additional major modernization of the National Weather Service (including ASOS, new satellites, and next generation computer system forecasting) occurred during this period as well. This set the stage for better forecasts, more accurate warnings for severe weather, and further research into the formation of tornadoes.
The nationwide network of Doppler radars was completed by the mid-1990s. During this process, Doppler velocity was incorporated, further improving tornado prediction ability by detecting any rotation present in a storm at different scan angles. Volumetric scans also became available allowing further investigation of storms on radar and providing detailed wind information.
Twister also hit the scene in the 1990s. The movie was undoubtedly a cause for increased storm chasing in the years and decades ahead. This was later enhanced by shows such as Discovery’s Storm Chasers.
The 2000s have brought a multitude of advancements, including additional tornado detection abilities in radar via the dual polarization upgrade. An example of developments in private enterprise include the addition of Spotter Network in 2006. It uses GPS for more accurate locations and automatic positioning for spotters and chasers who relay information to those issuing warnings. The official NWS storm spotter network continues to grow, and there have never been more storm chasers. Eyes on storms are at an all-time high.
Finally, in 2007 the Enhanced Fujita Scale replaced the original Fujita Scale. It is of similar design to the F-Scale, but those who developed it believe it more accurately matches wind speeds to severity of damage caused by a tornado. The EF-Scale was formulated thanks to research that suggested the wind speeds required to cause damage per the Fujita Scale were greatly overestimated. The EF-Scale also improved damage parameter descriptions.
As the science continues to become better and better, it is worth keeping in mind how quickly things have changed over the modern history. Despite advancements, it is possible there are still many tornadoes that are not detected. While we have a good idea of the ceilings, with big years like 2011 and 2008 behind us, there is still much we don’t know.
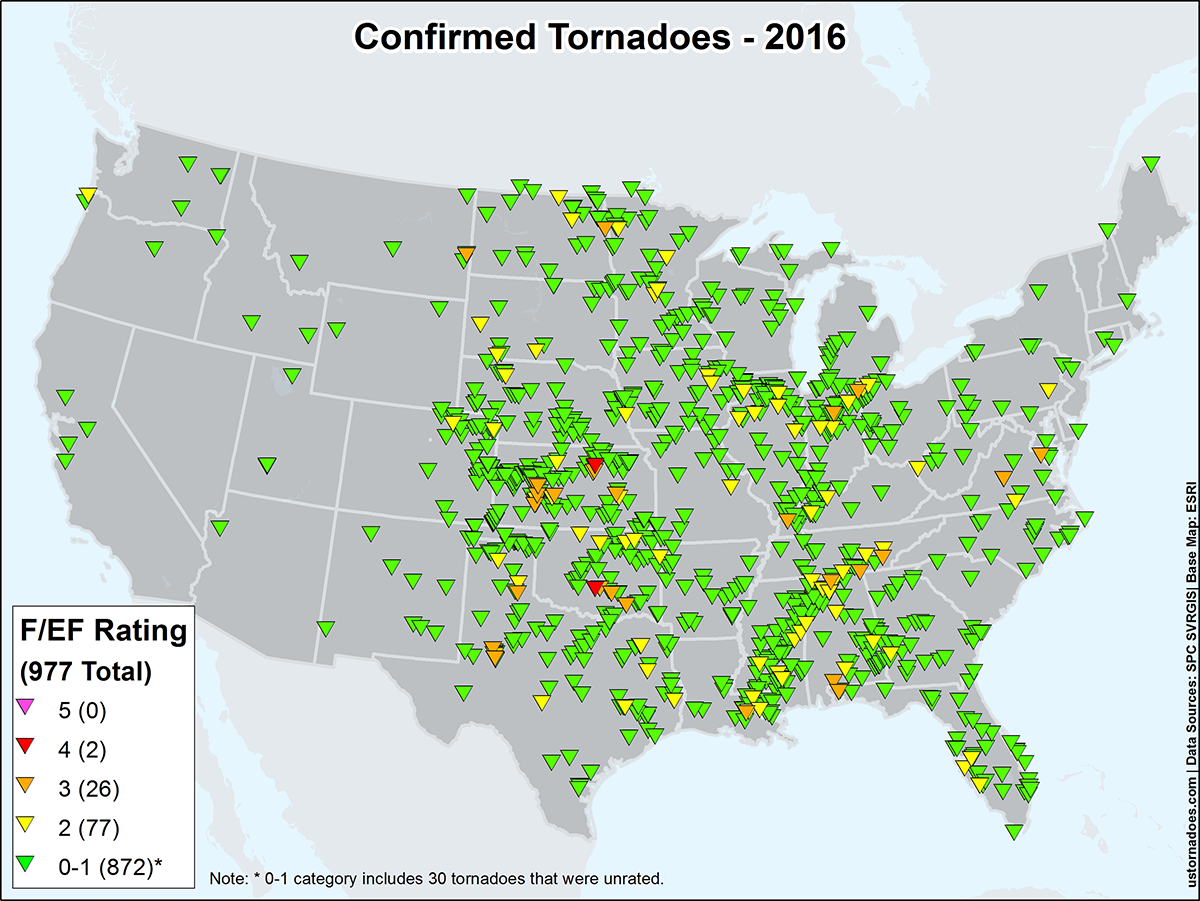
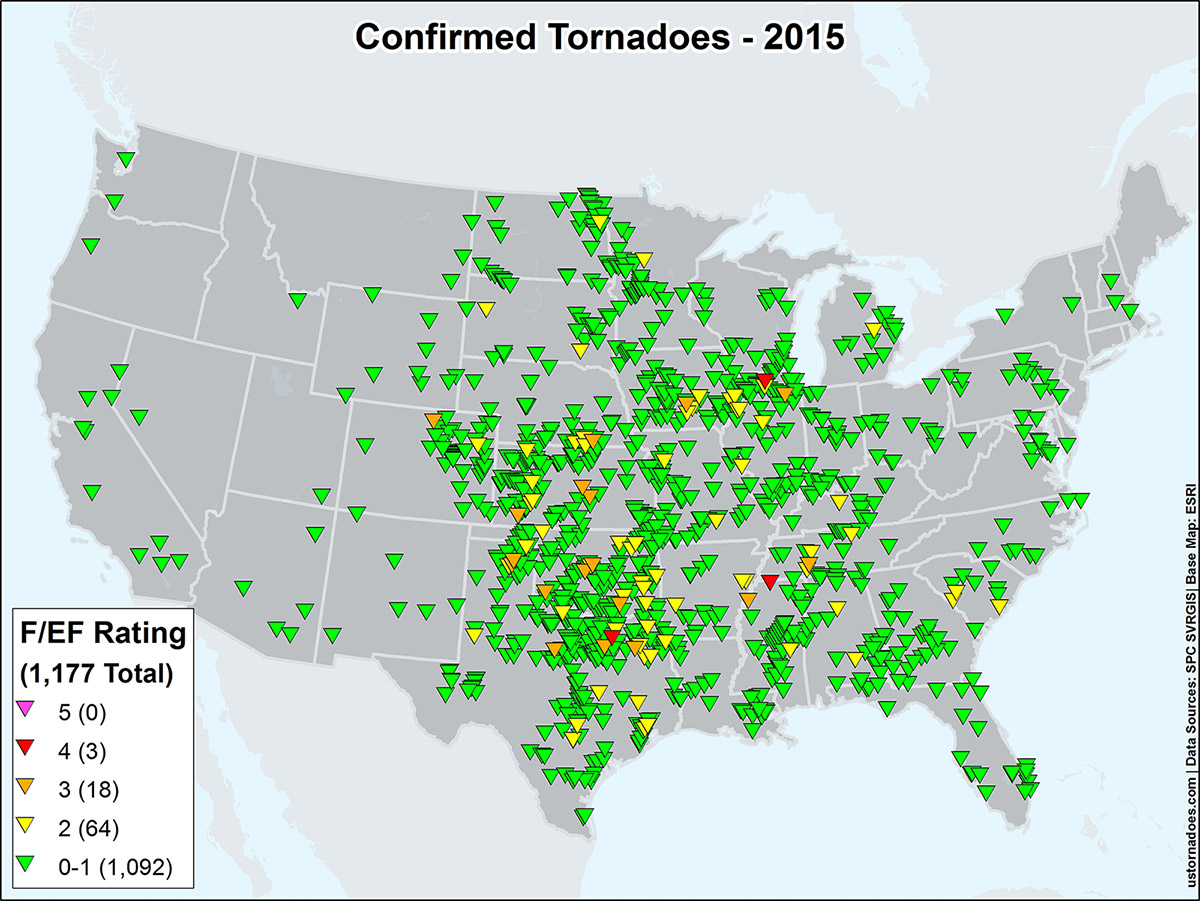
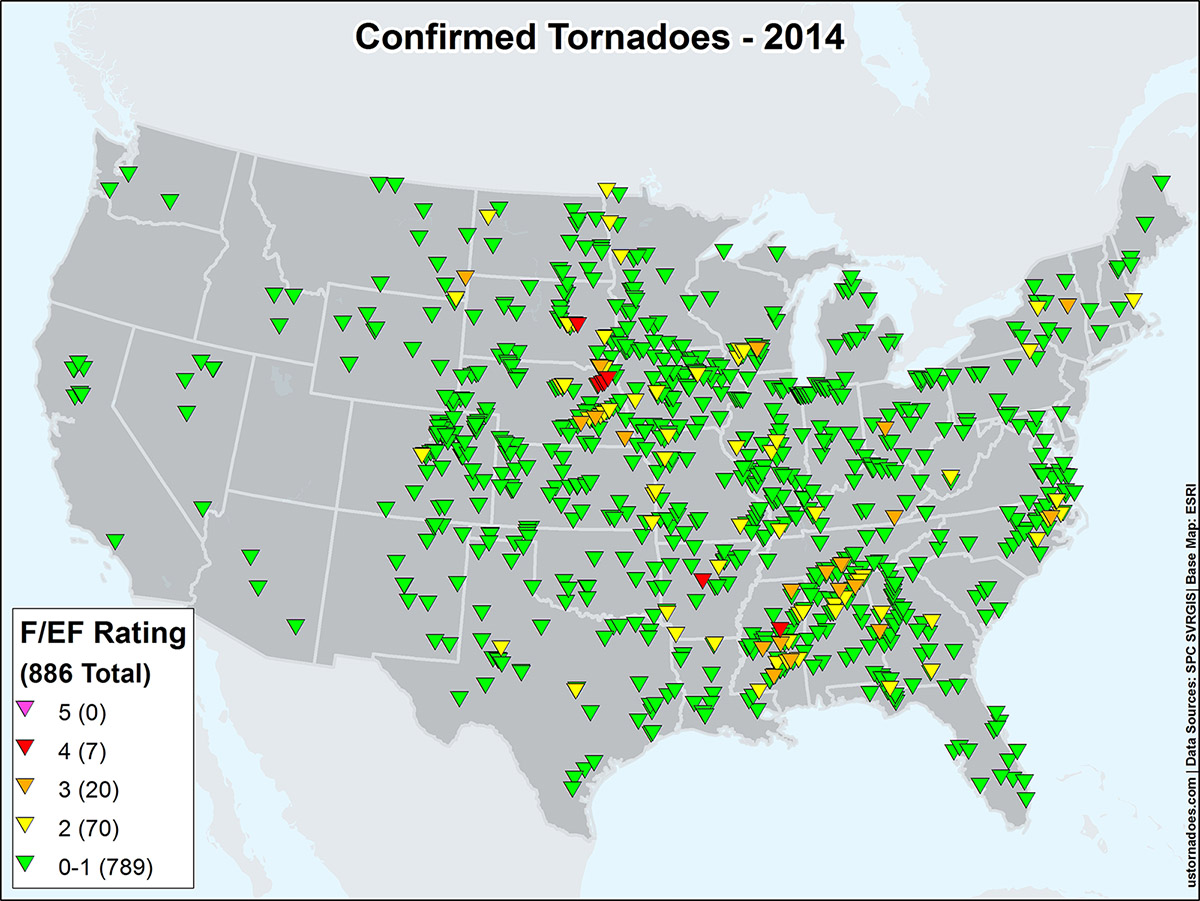
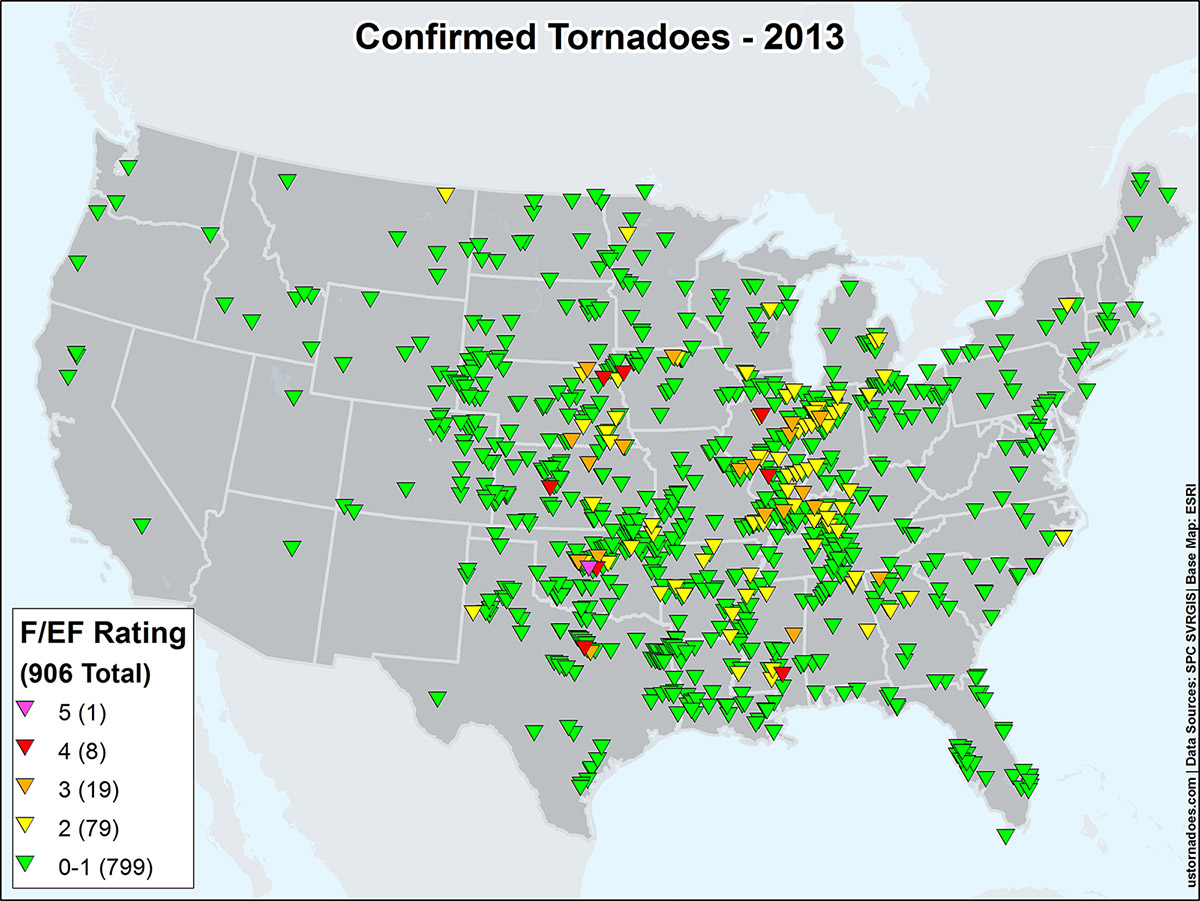
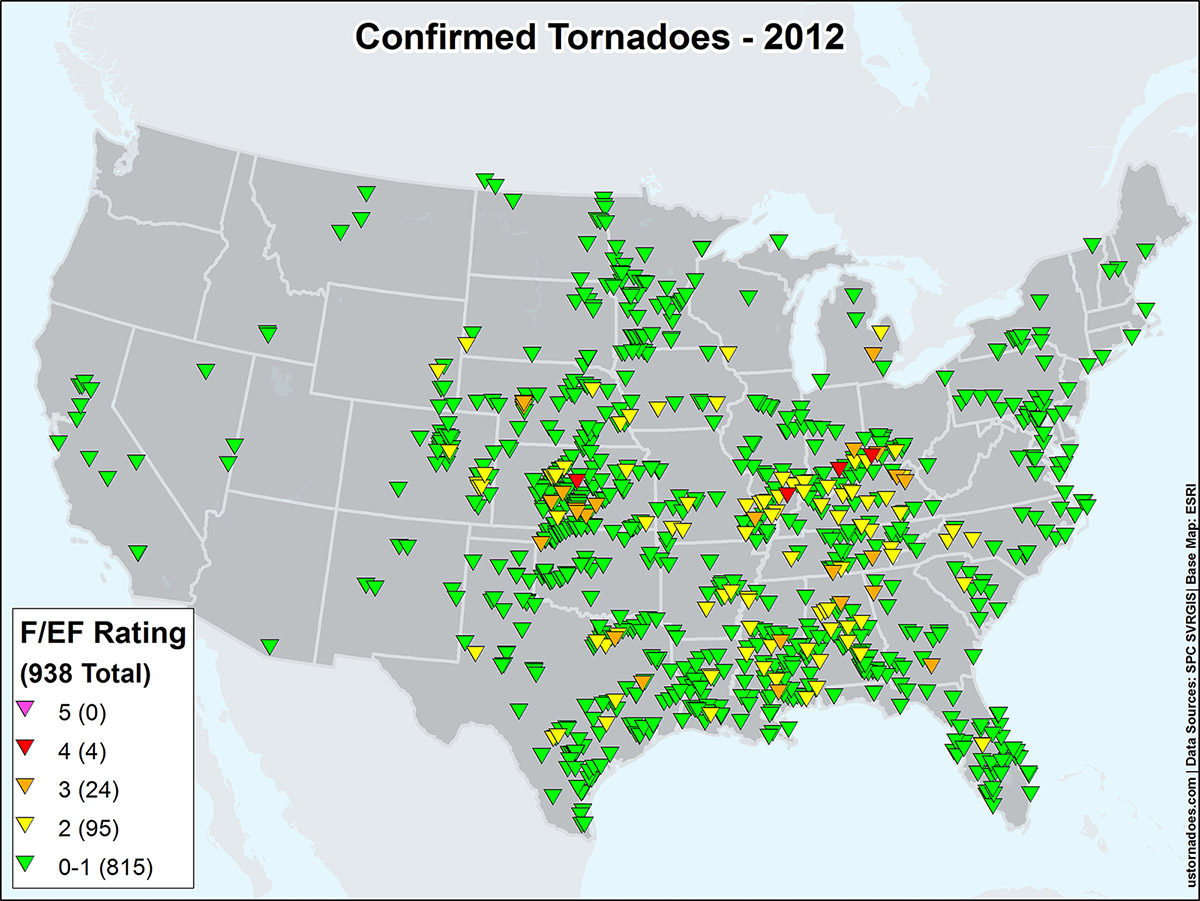
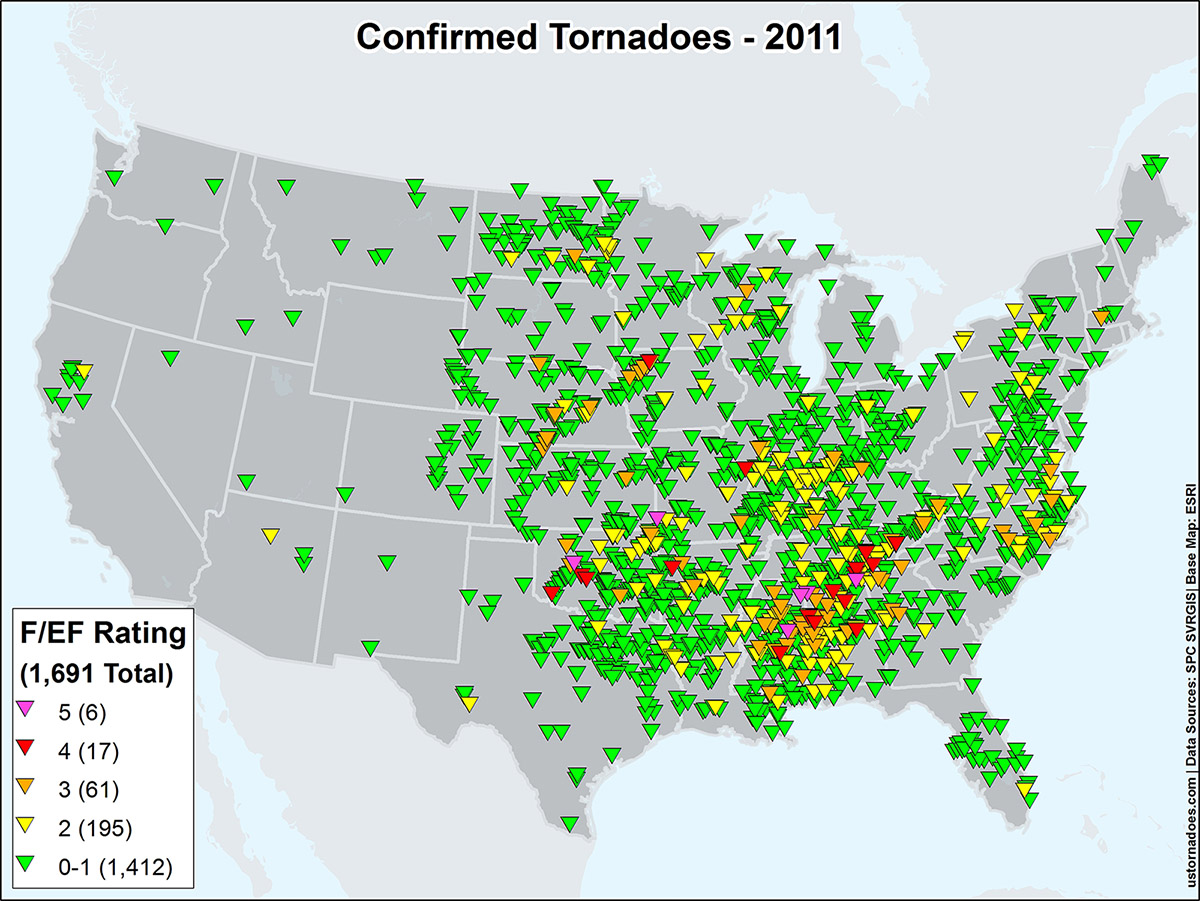
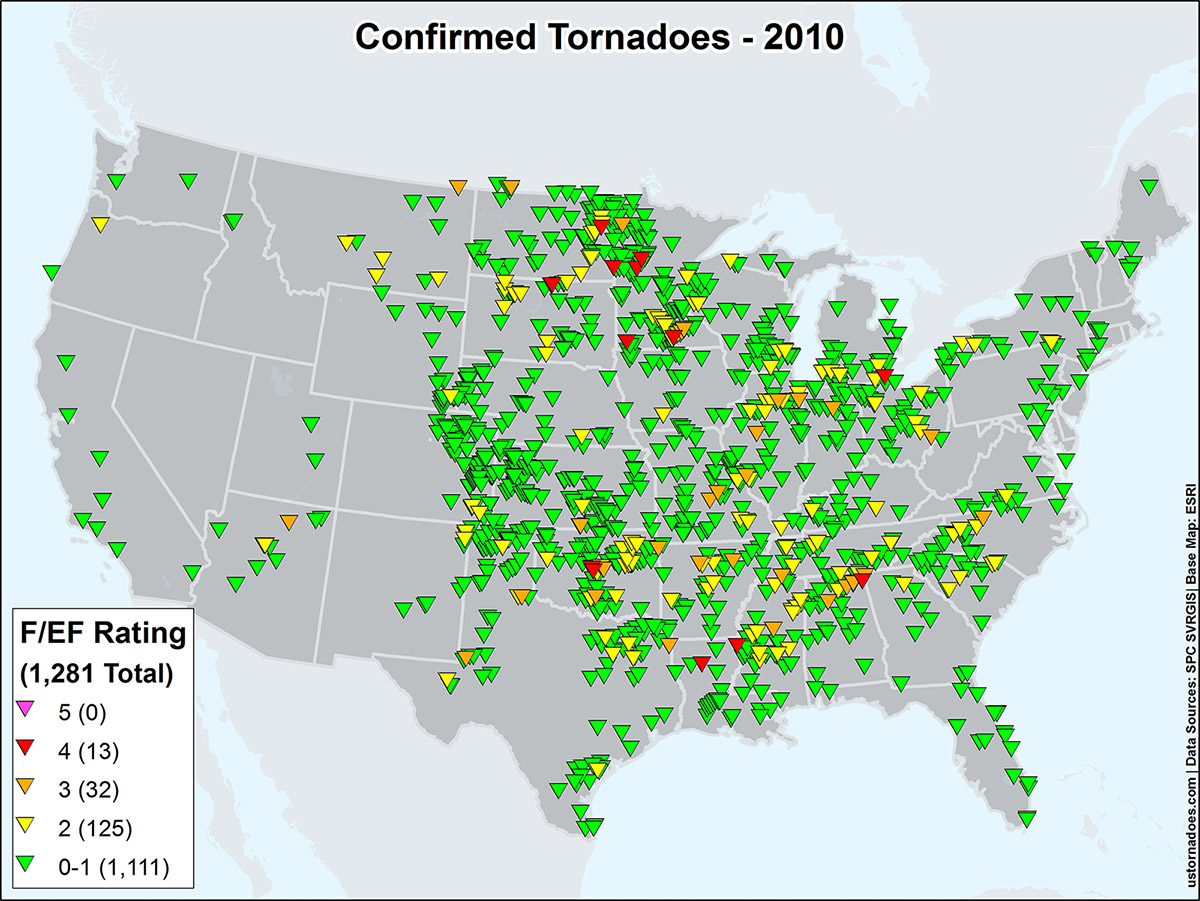
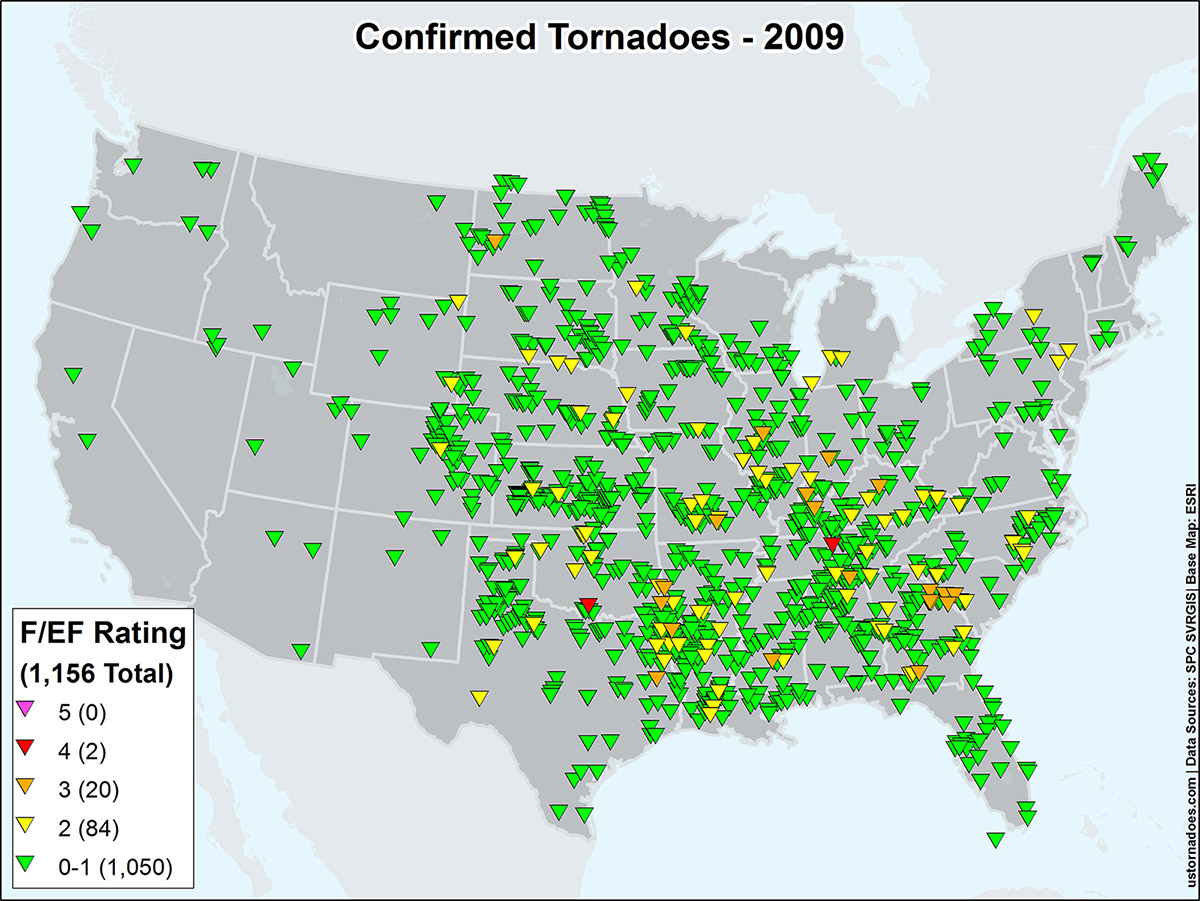
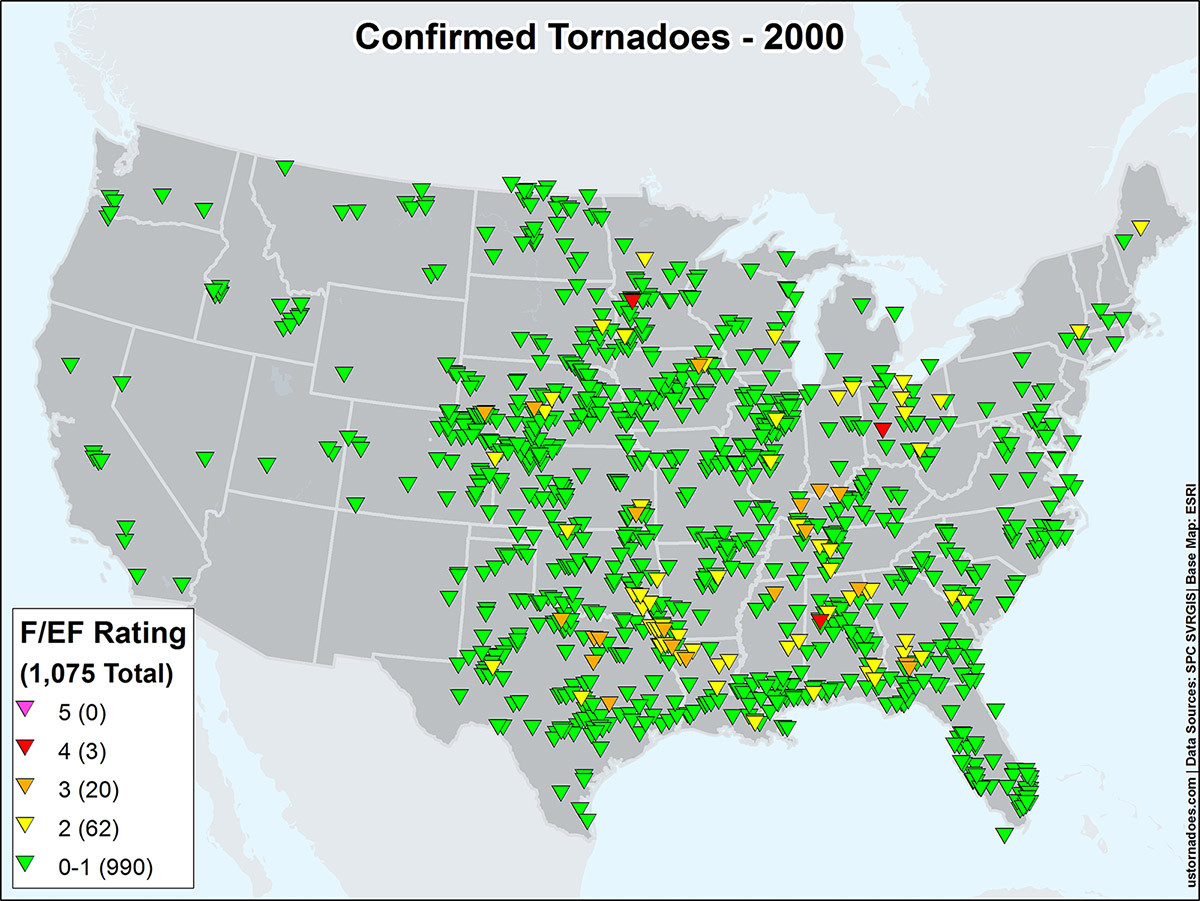
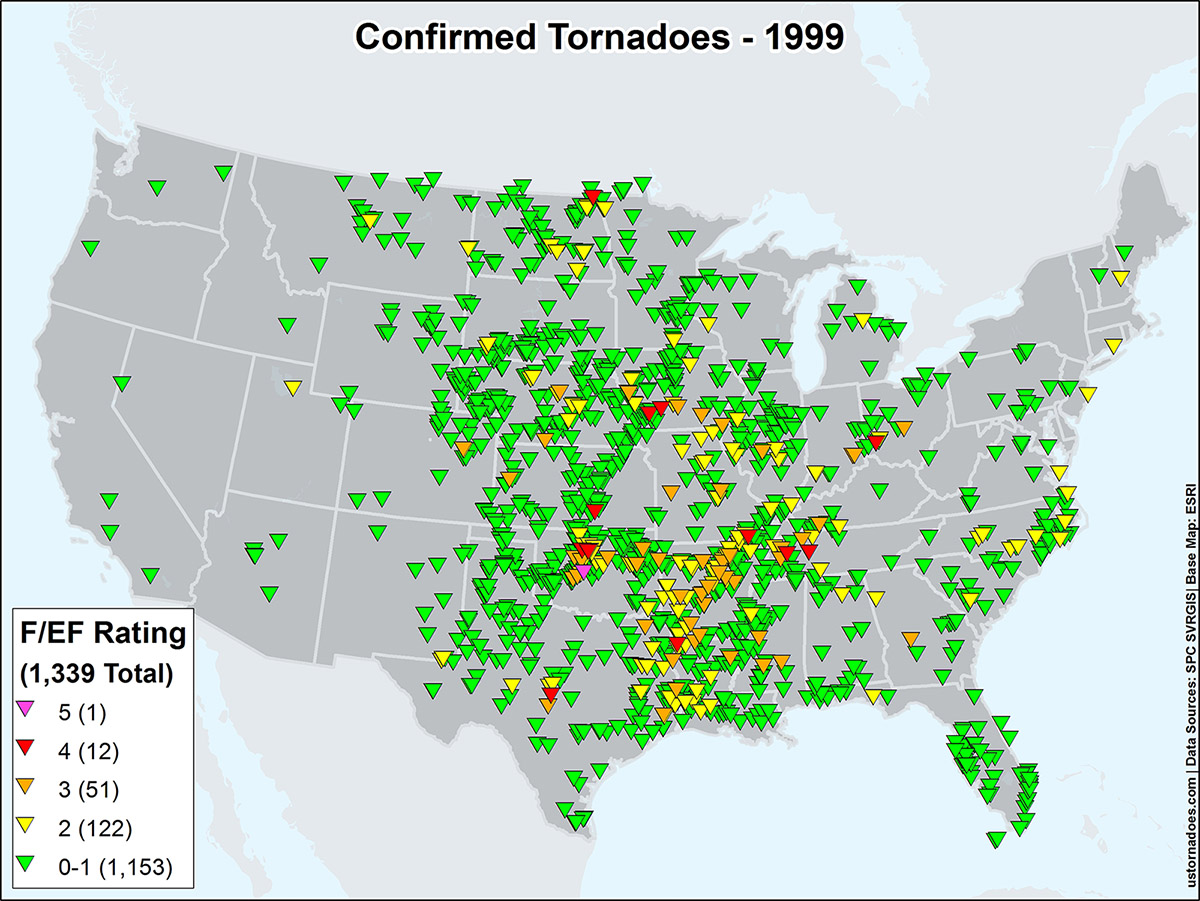
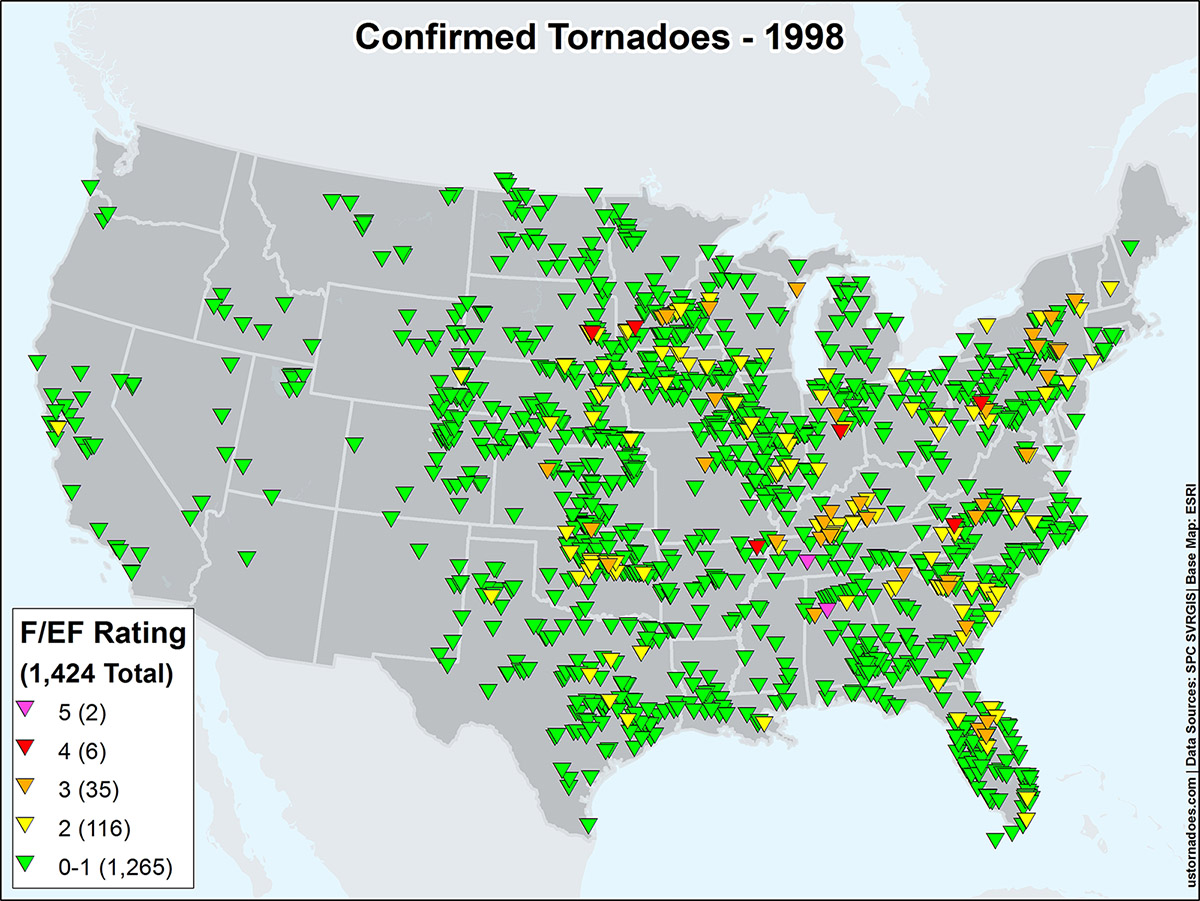
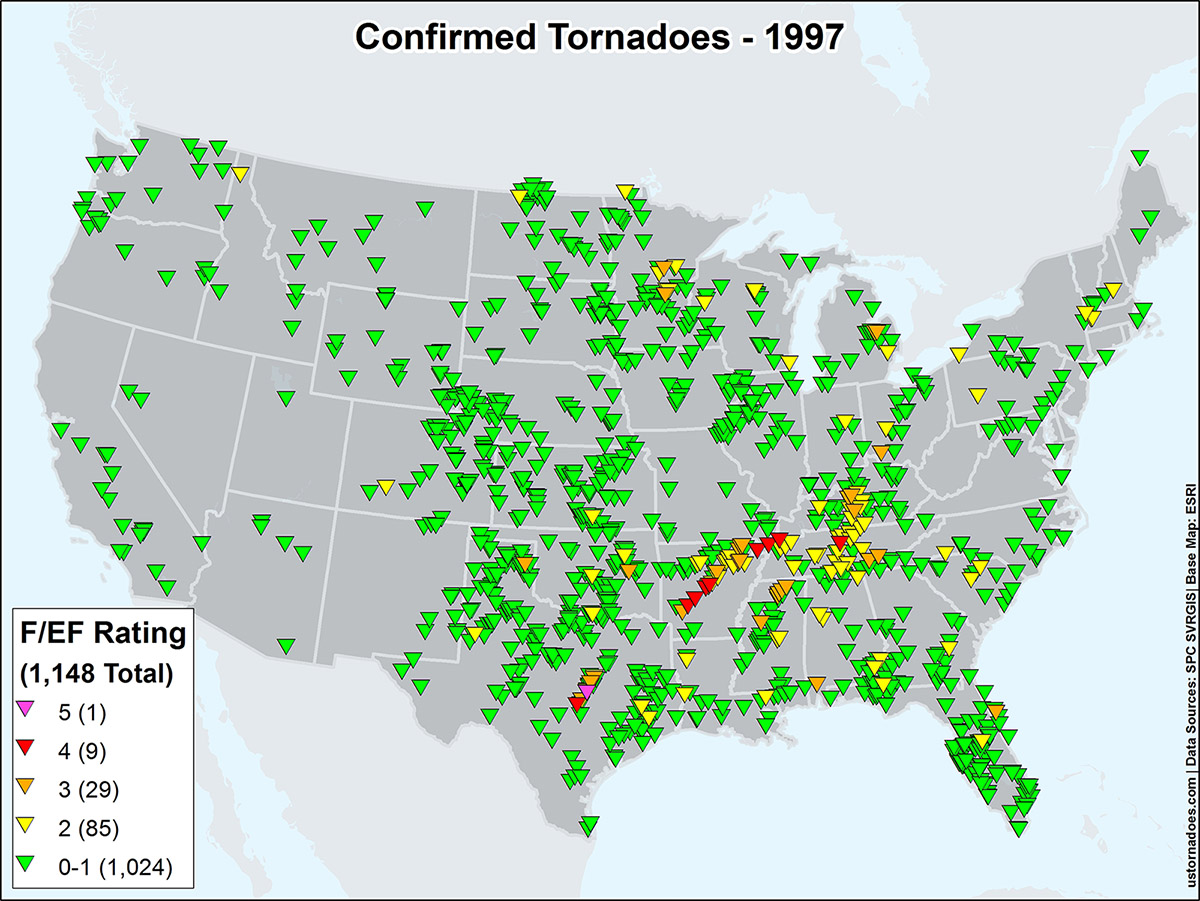
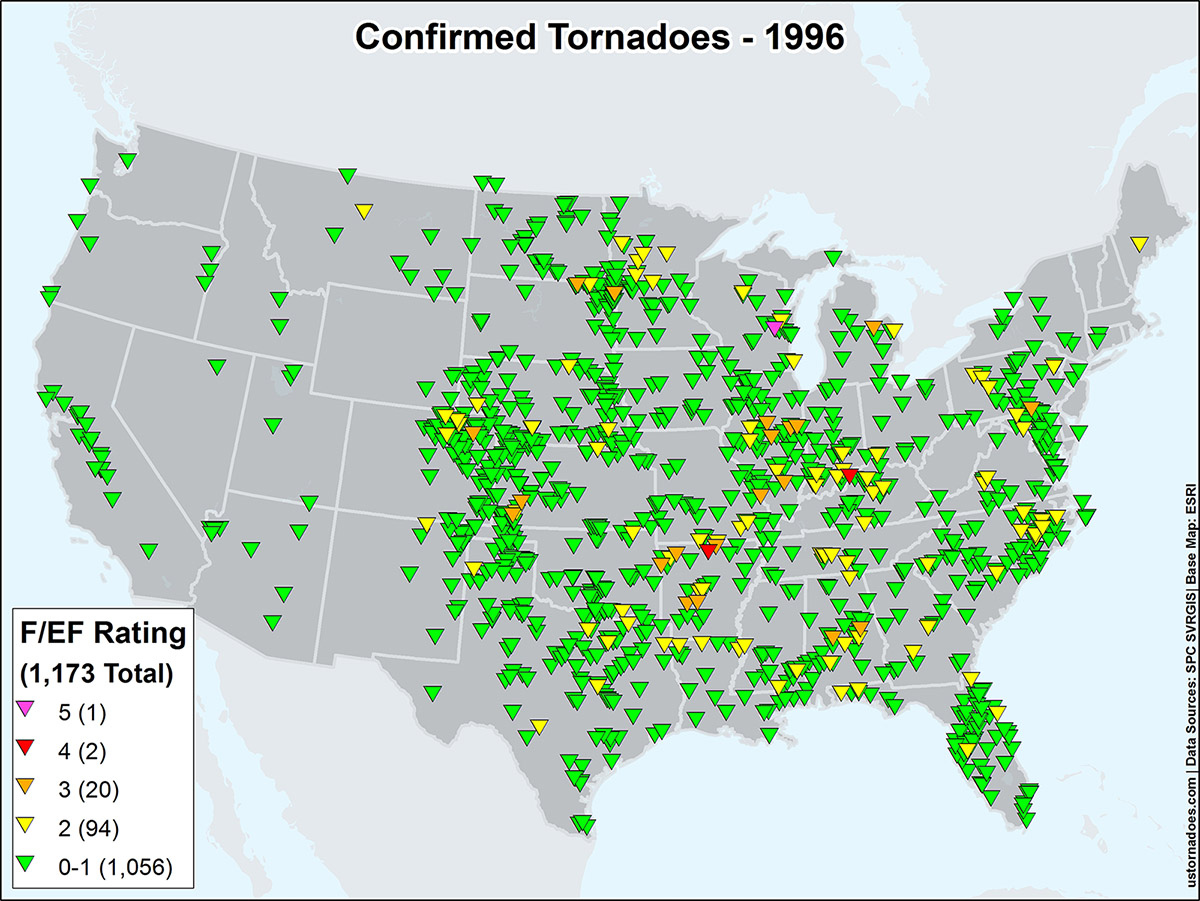
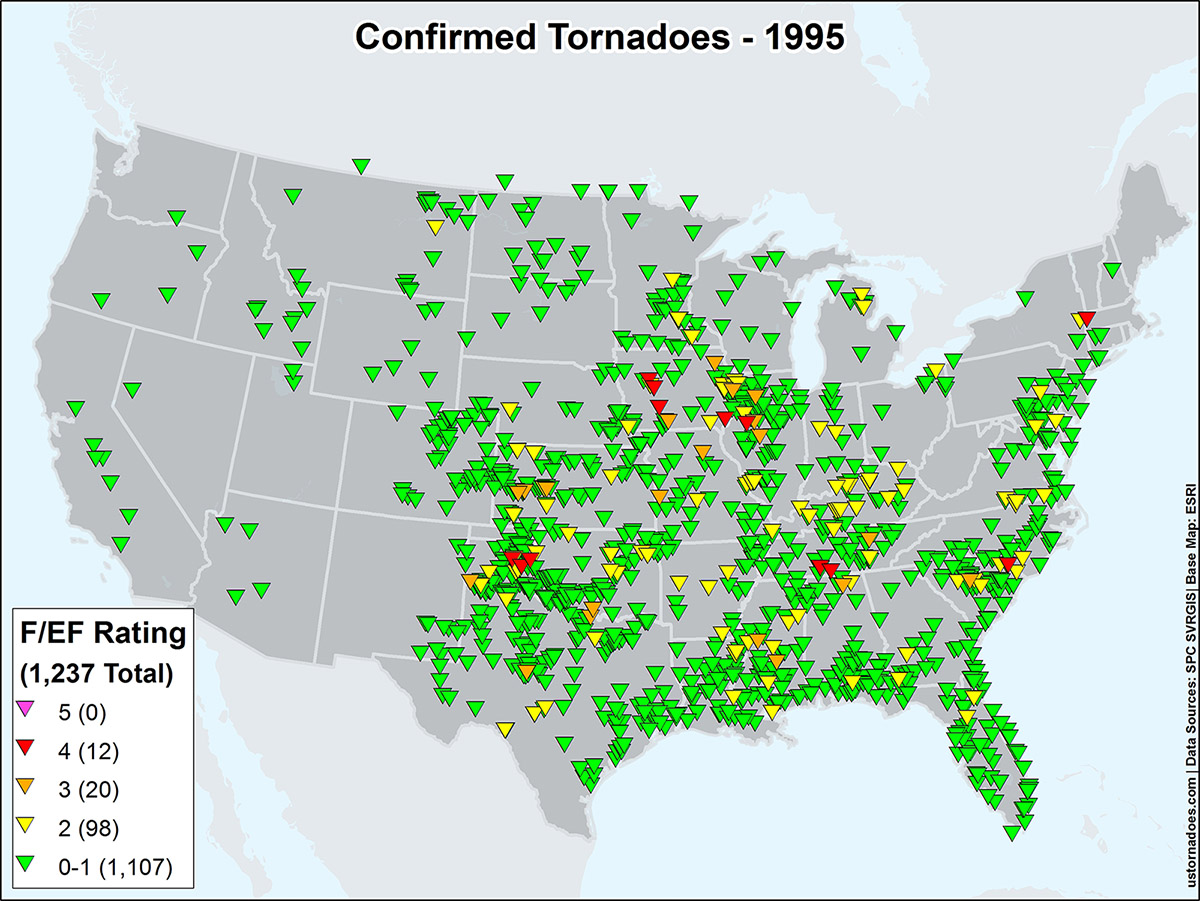
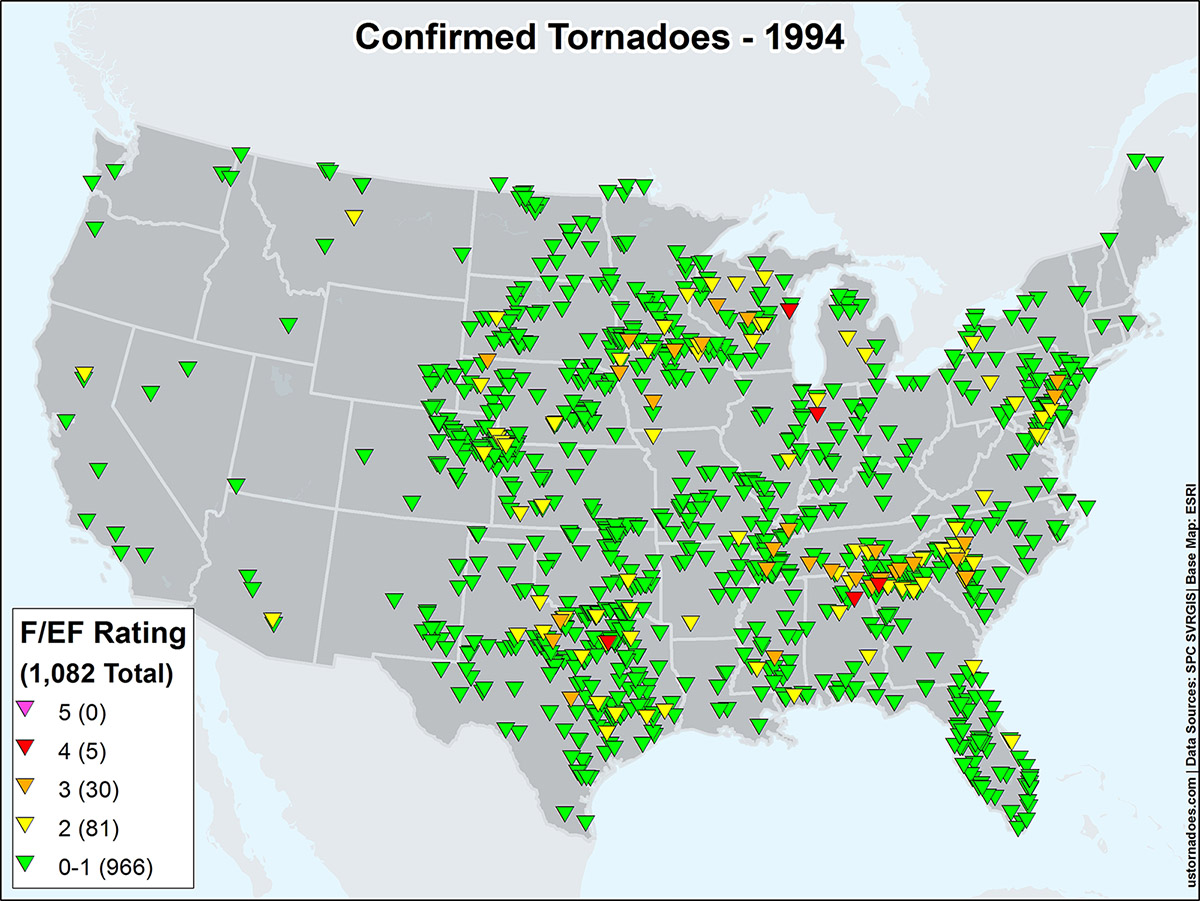
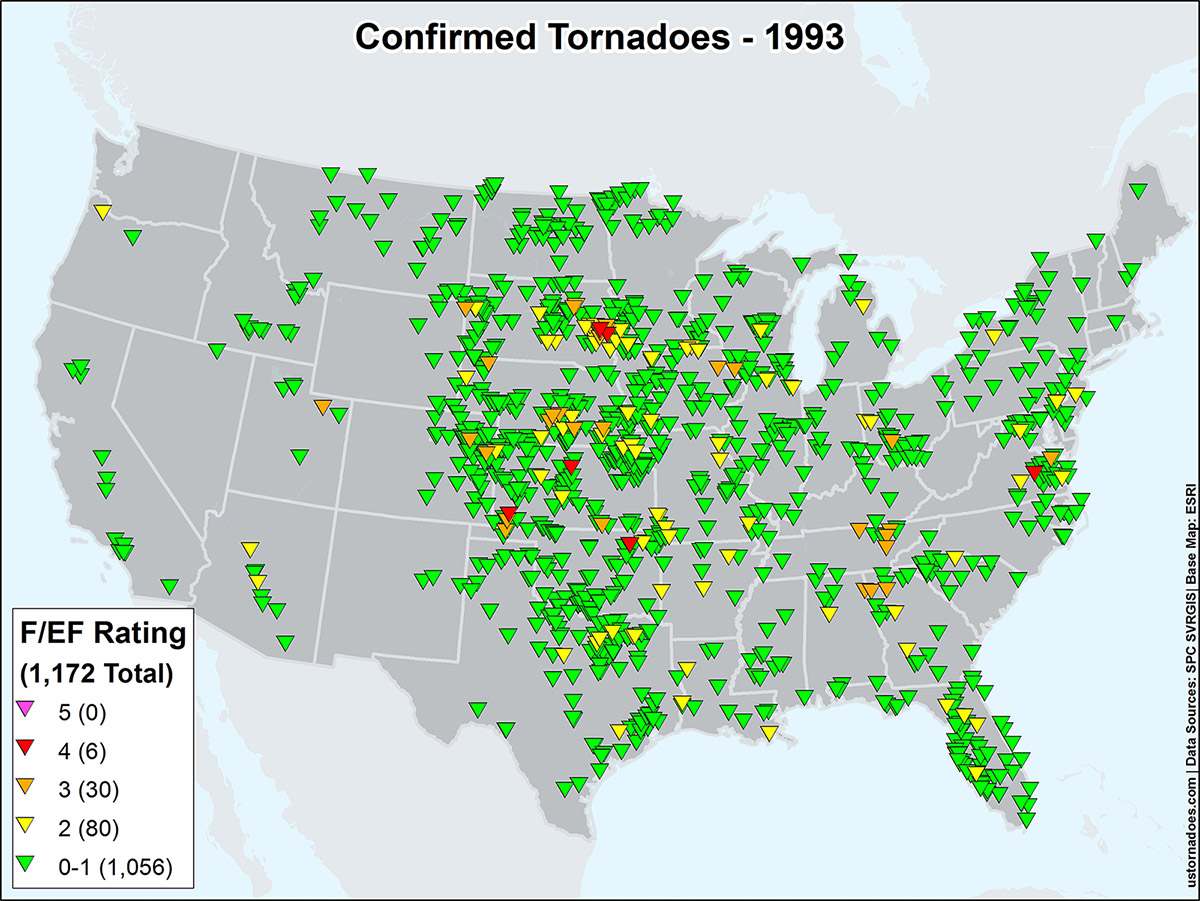
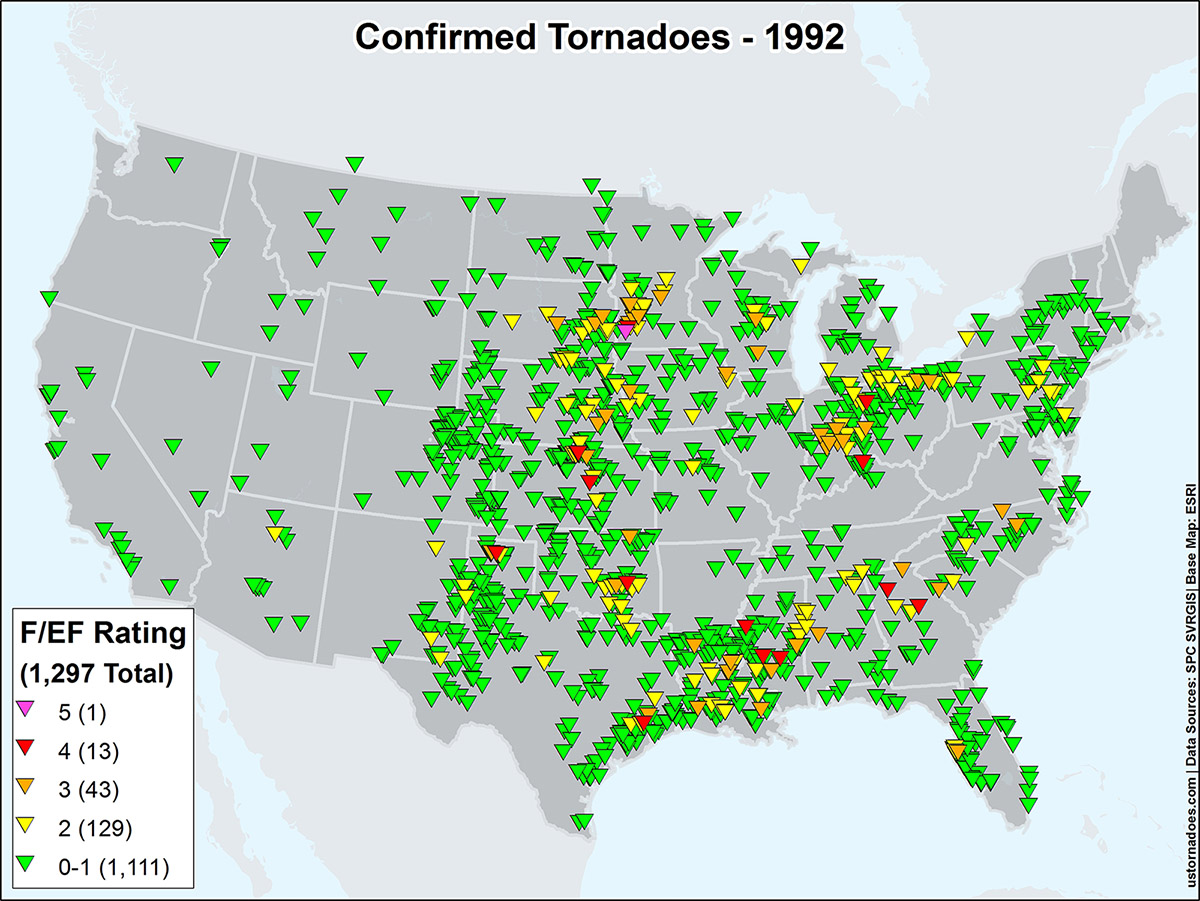
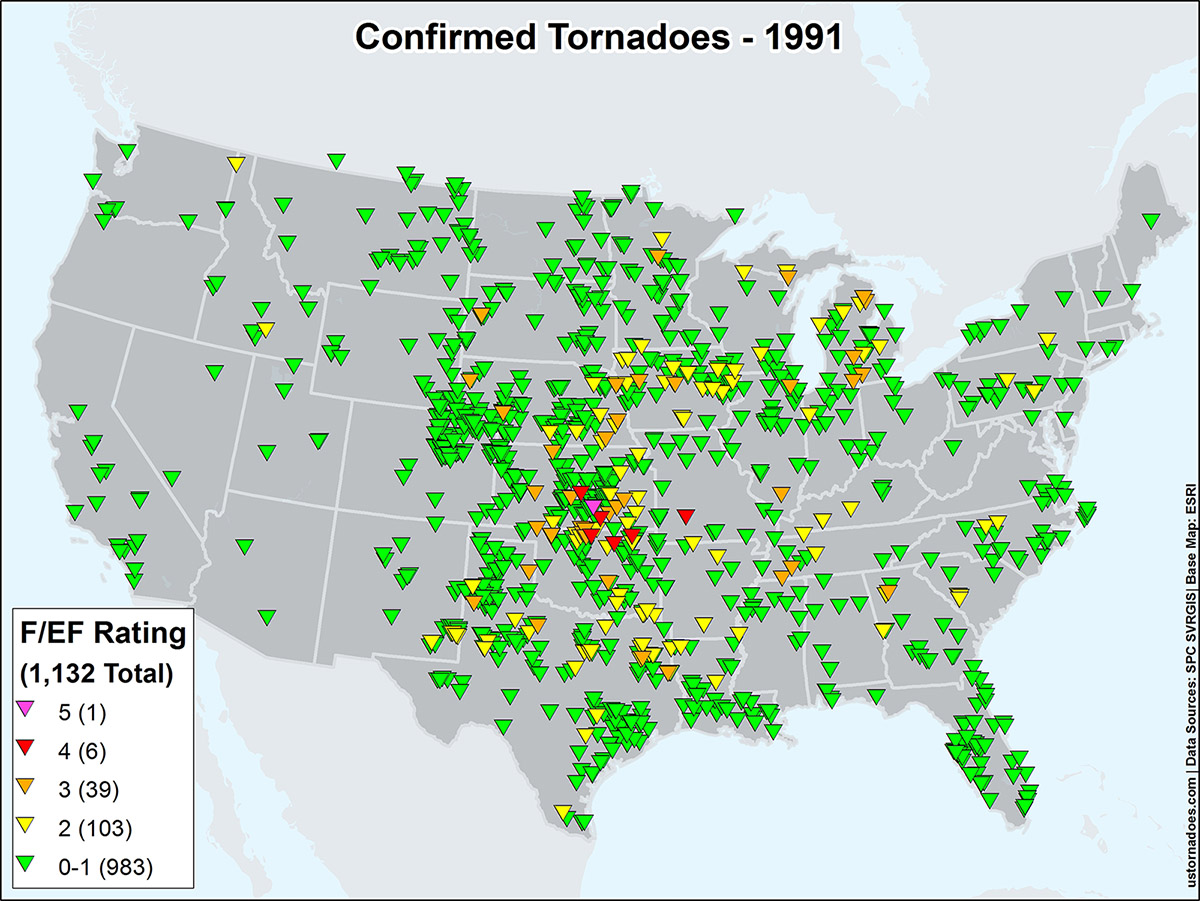
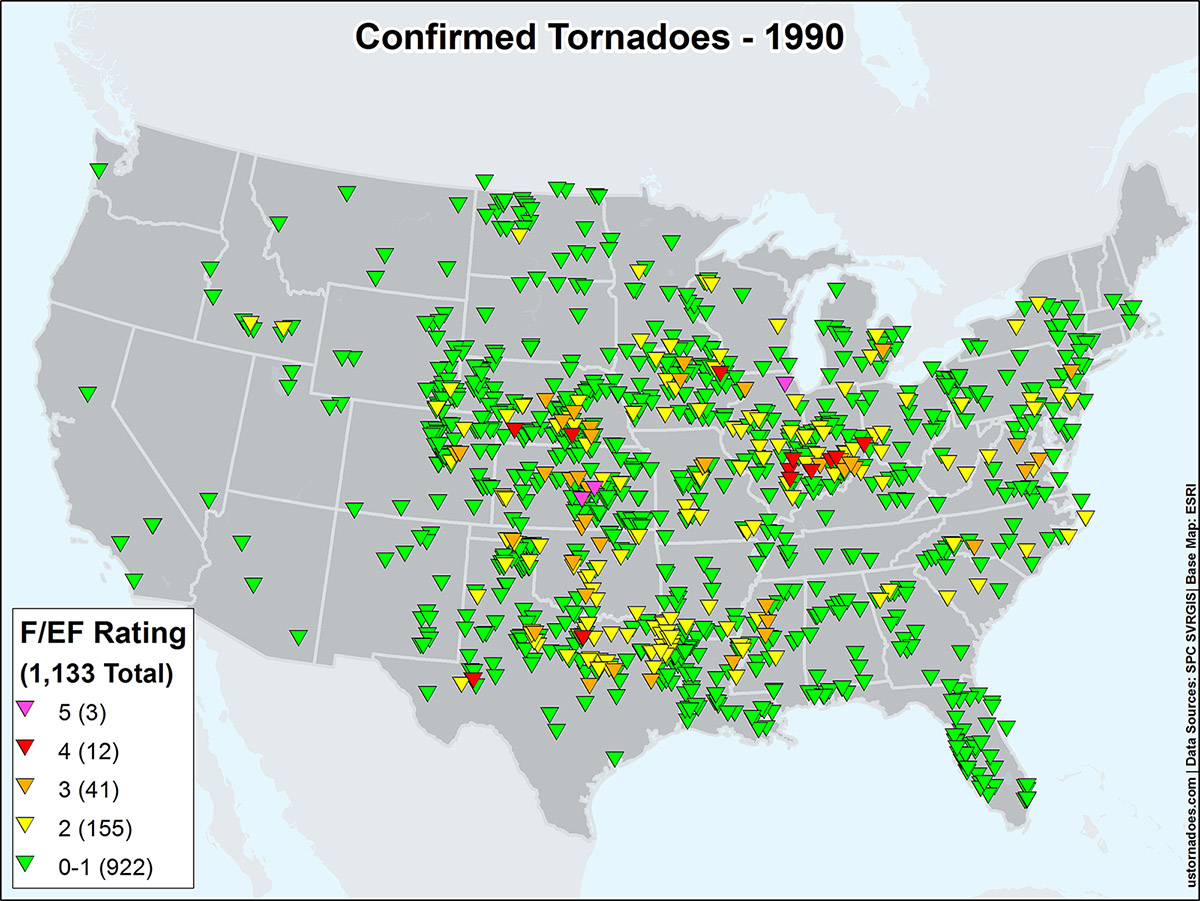
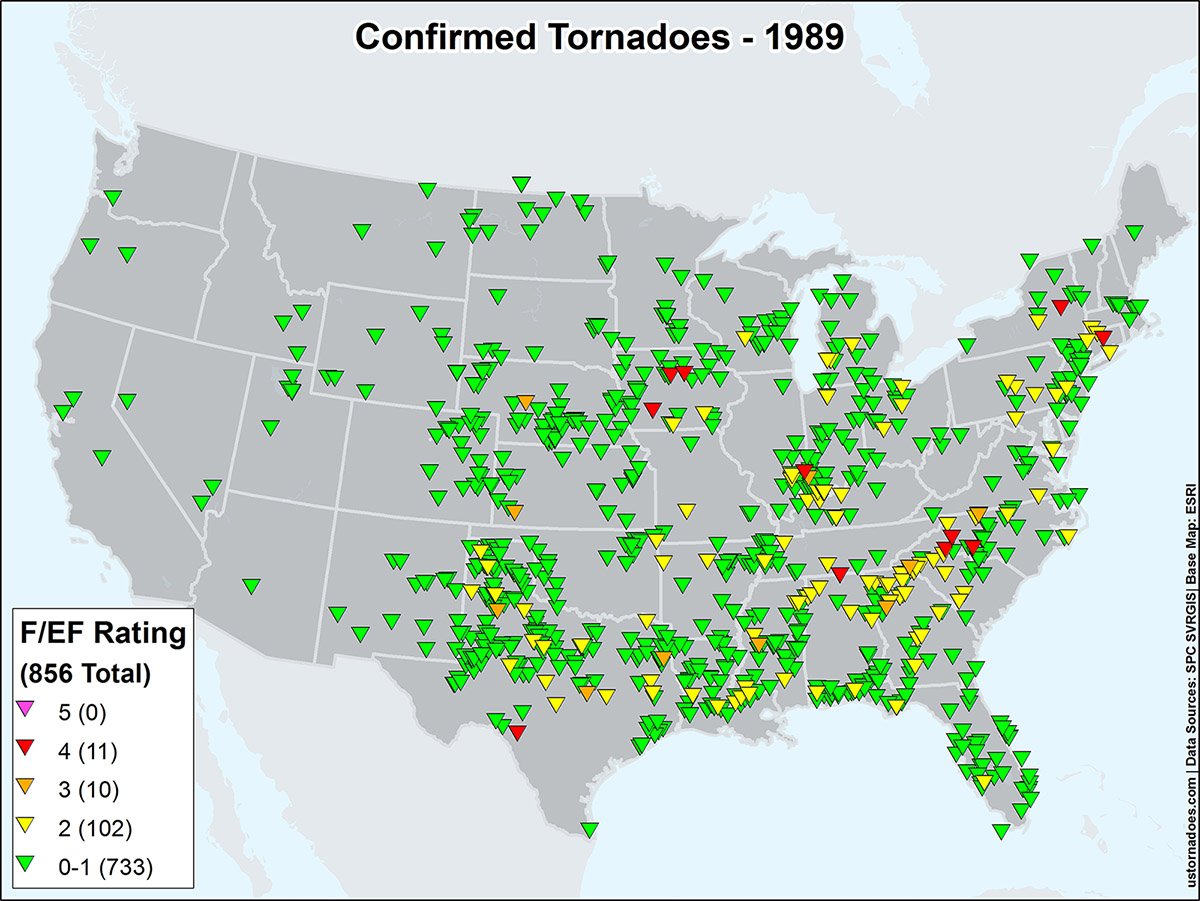
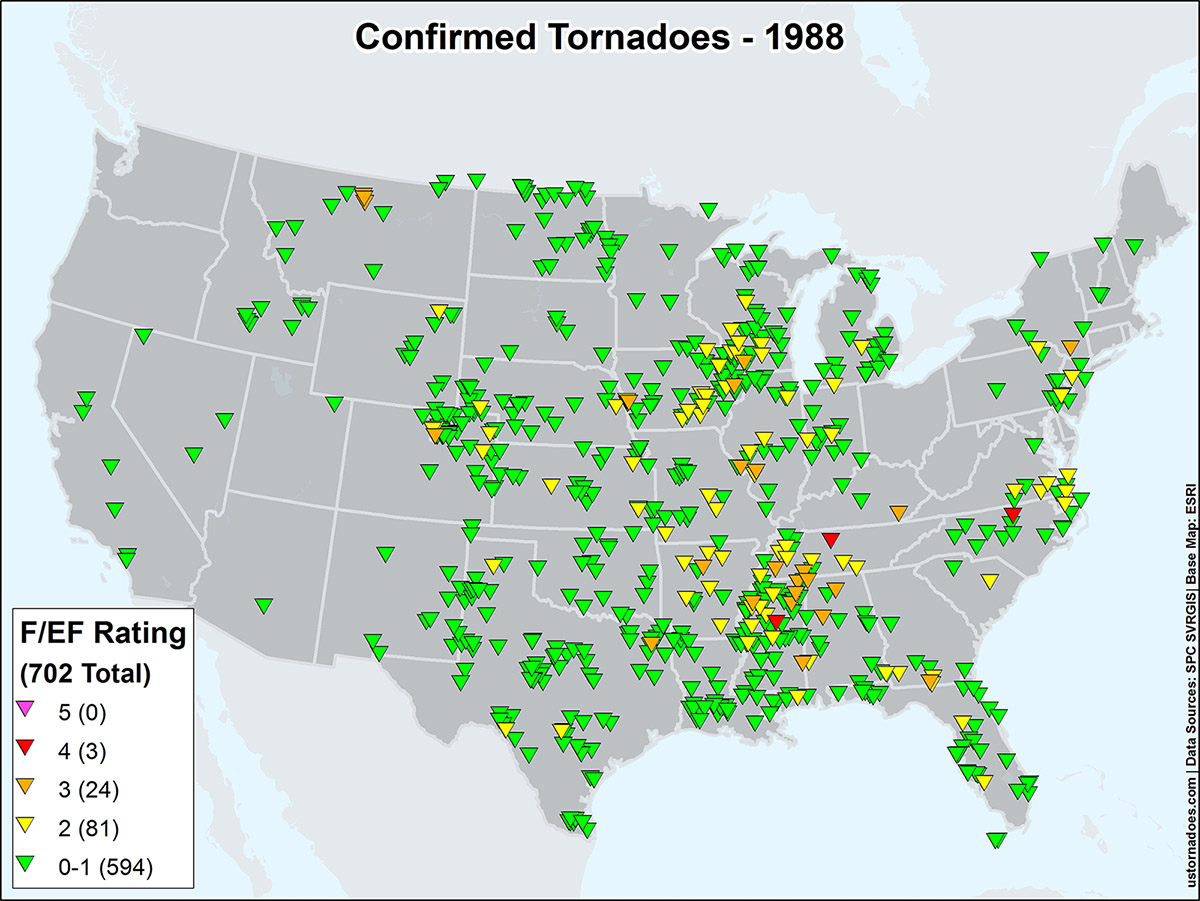
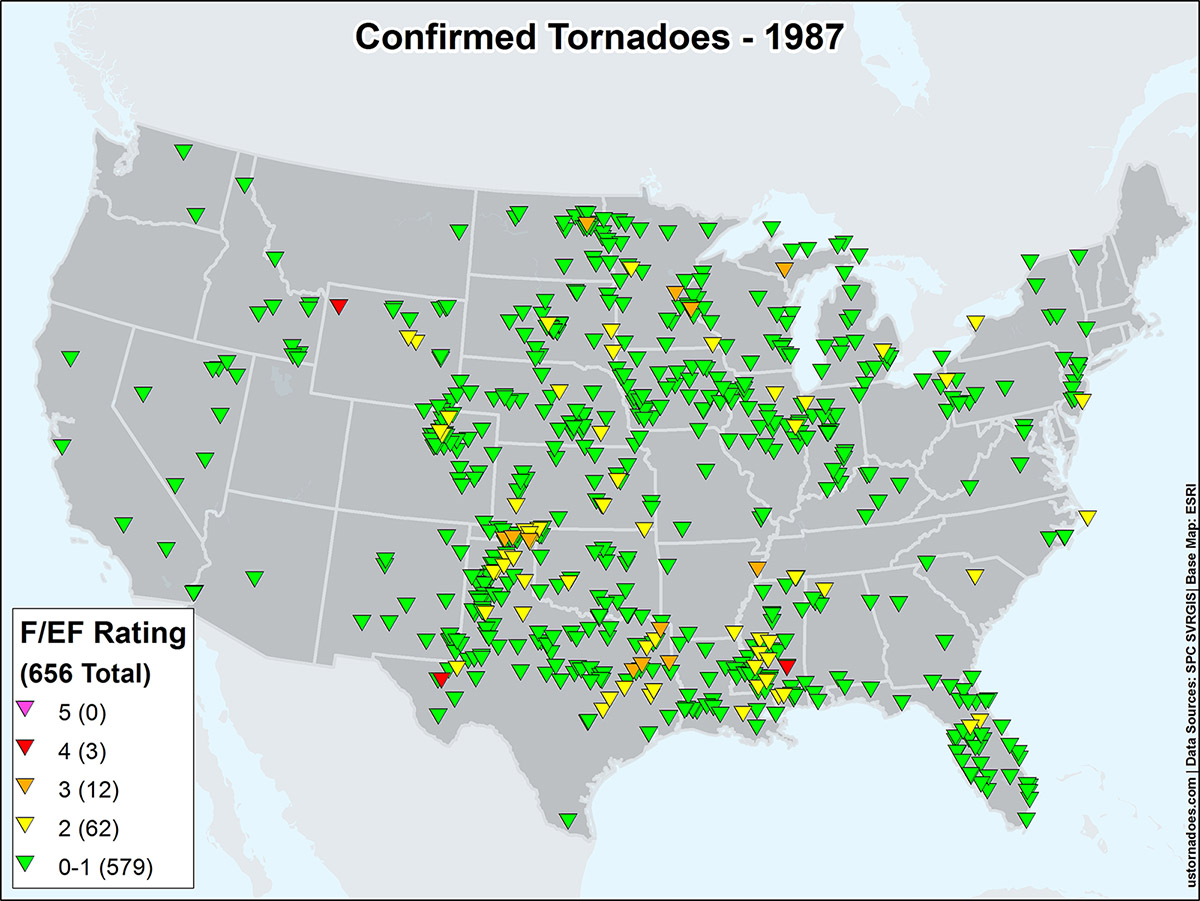
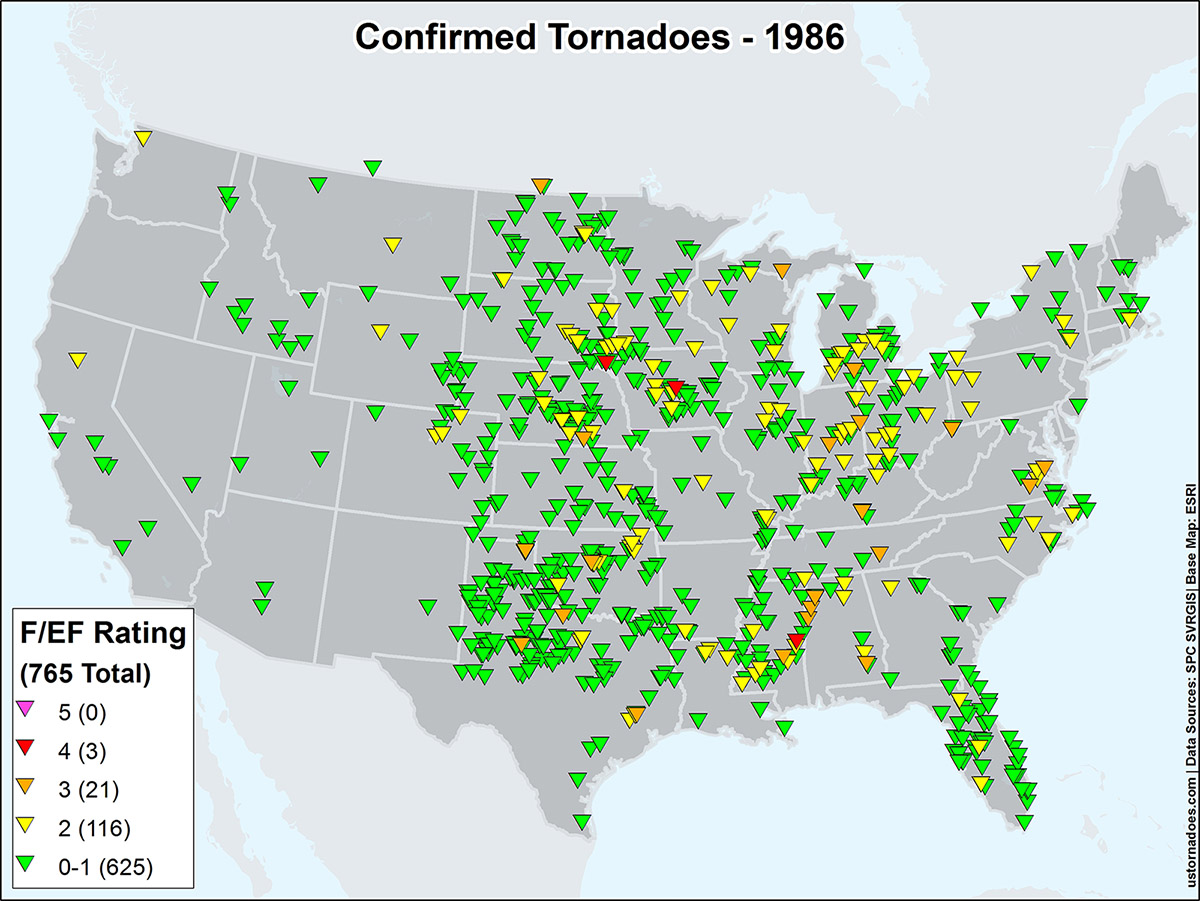
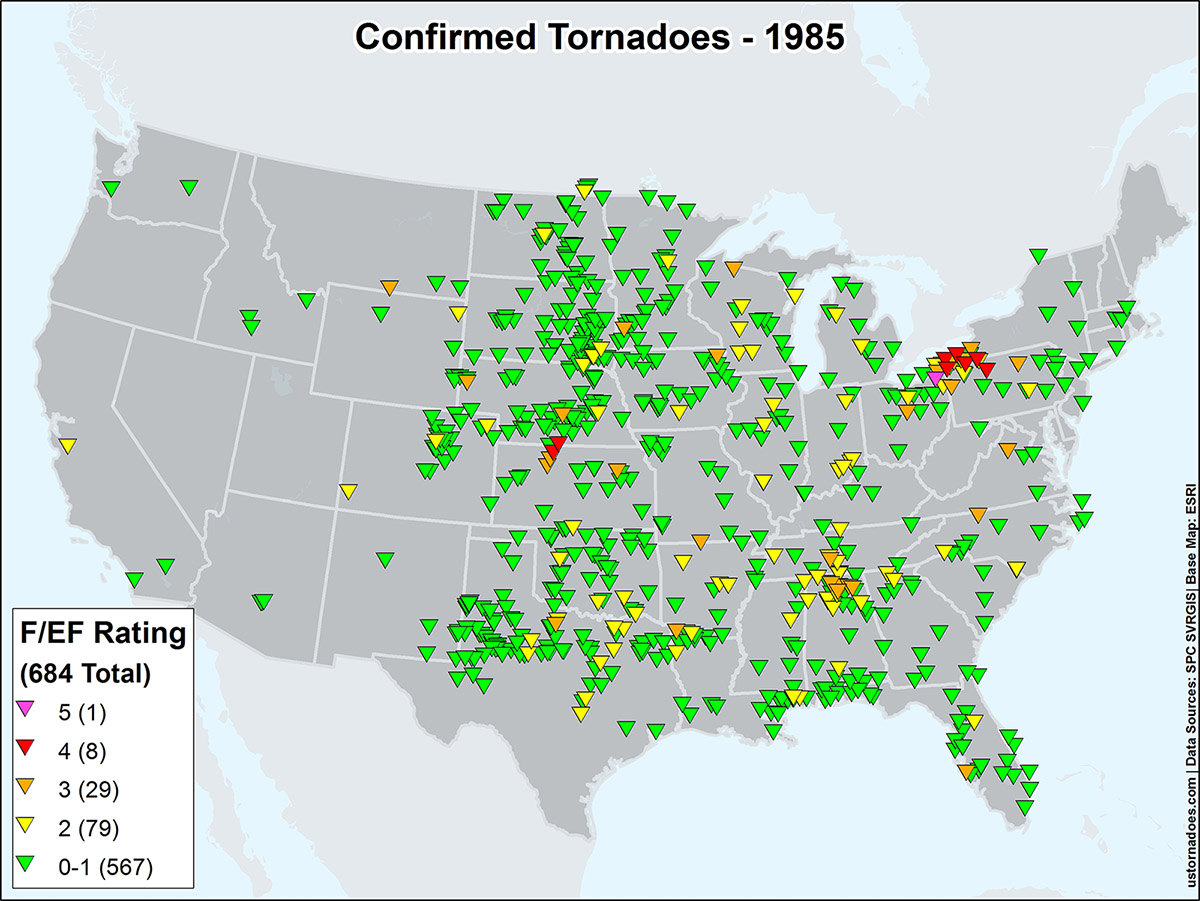
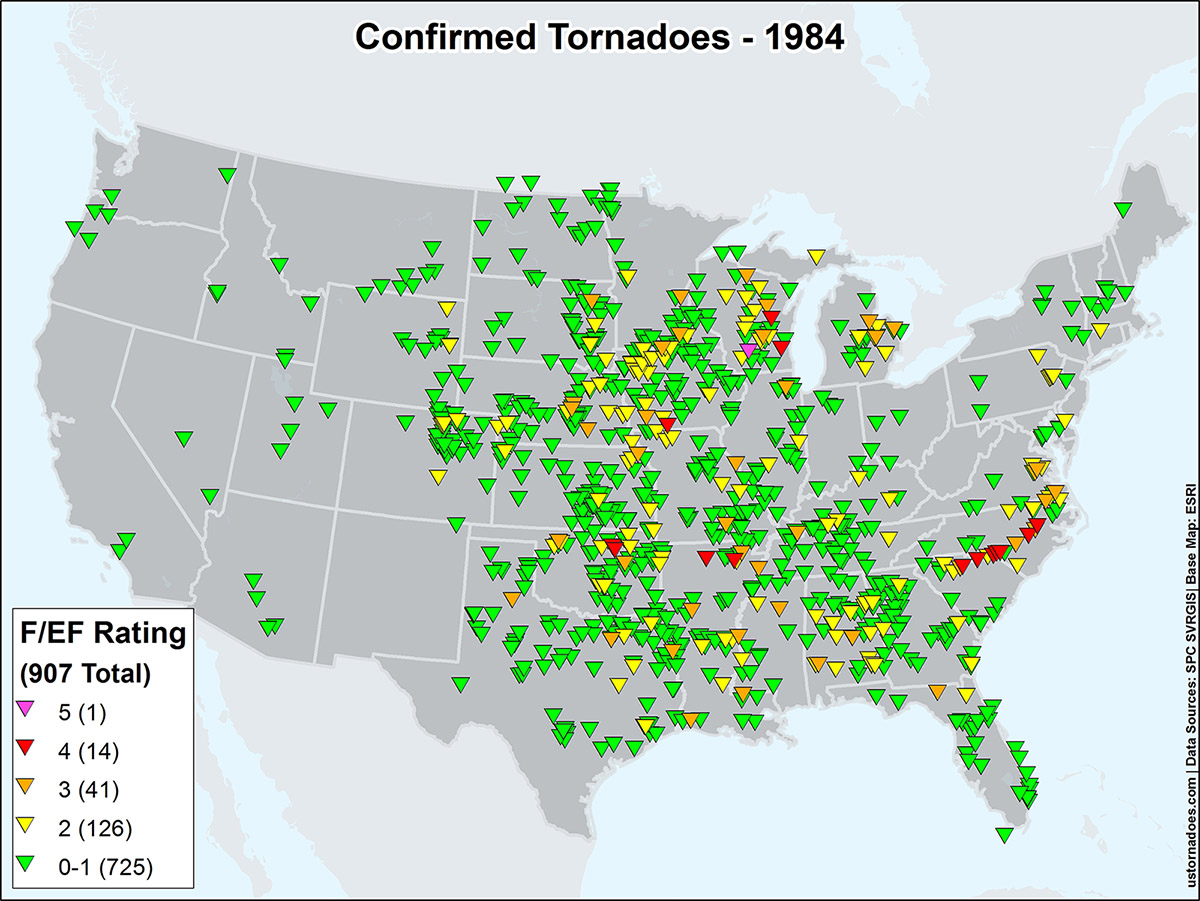
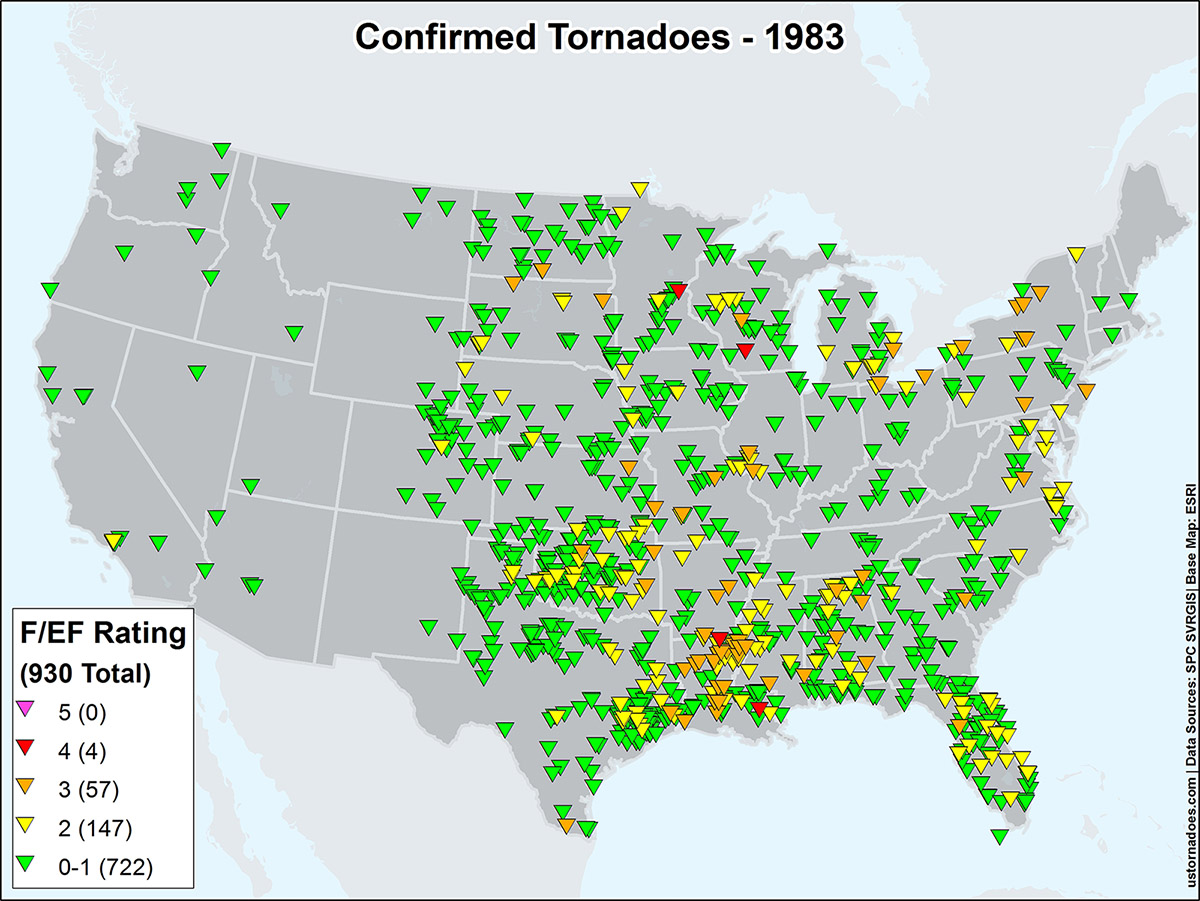
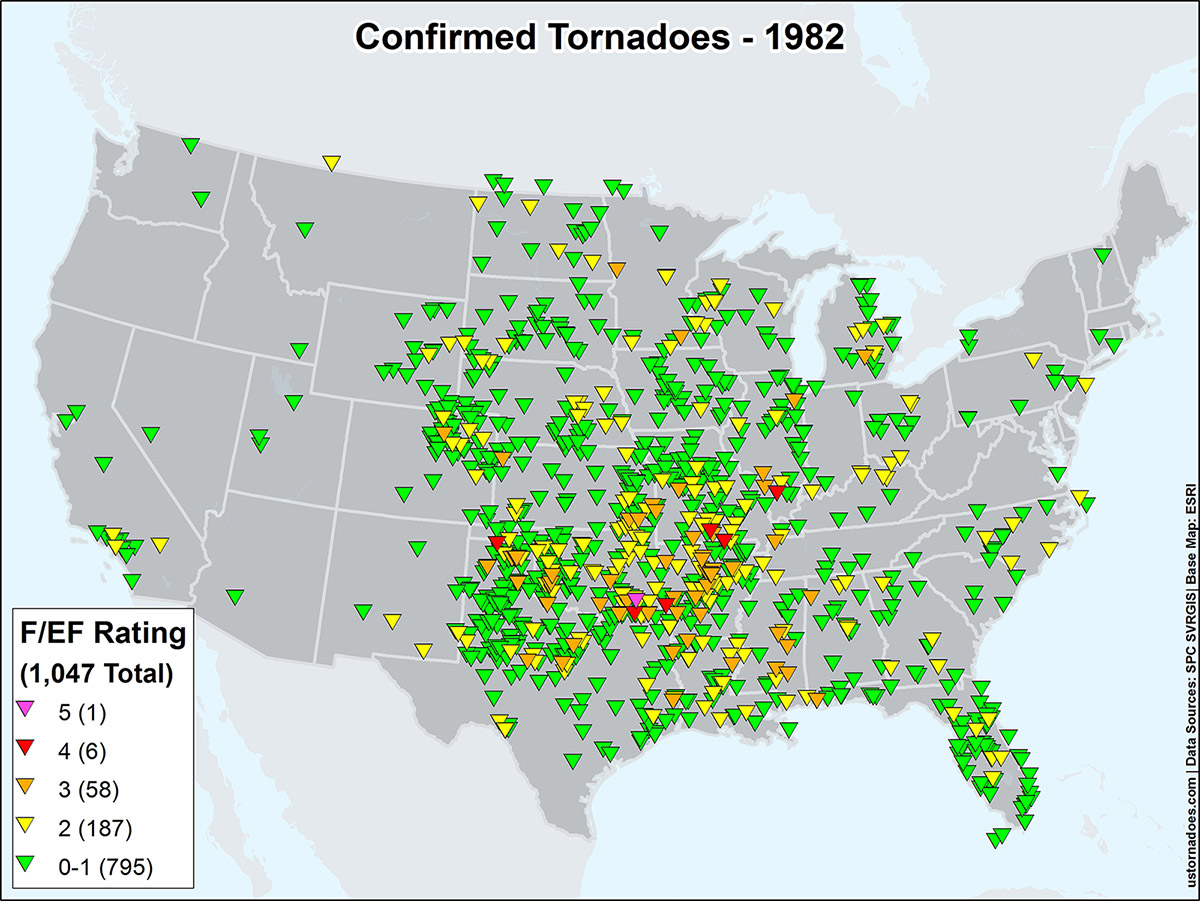
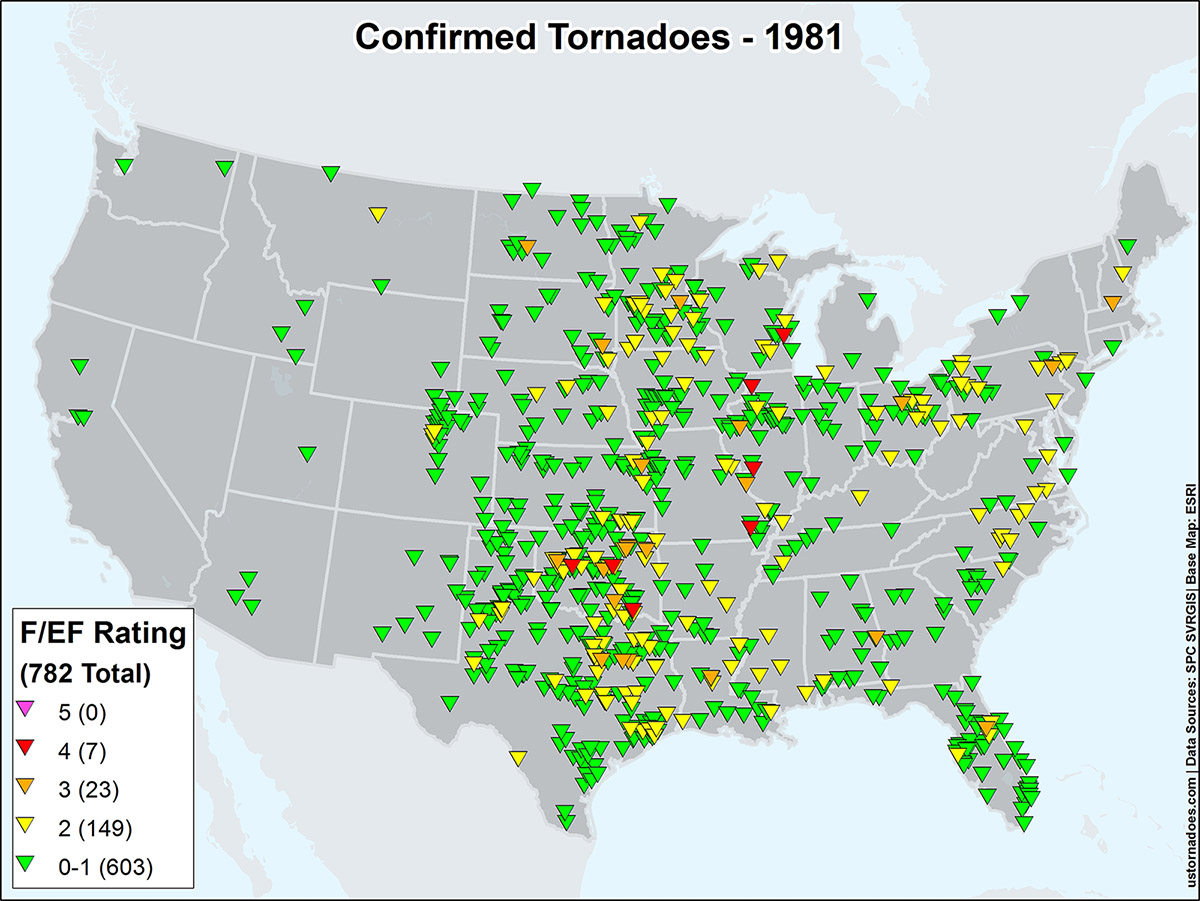
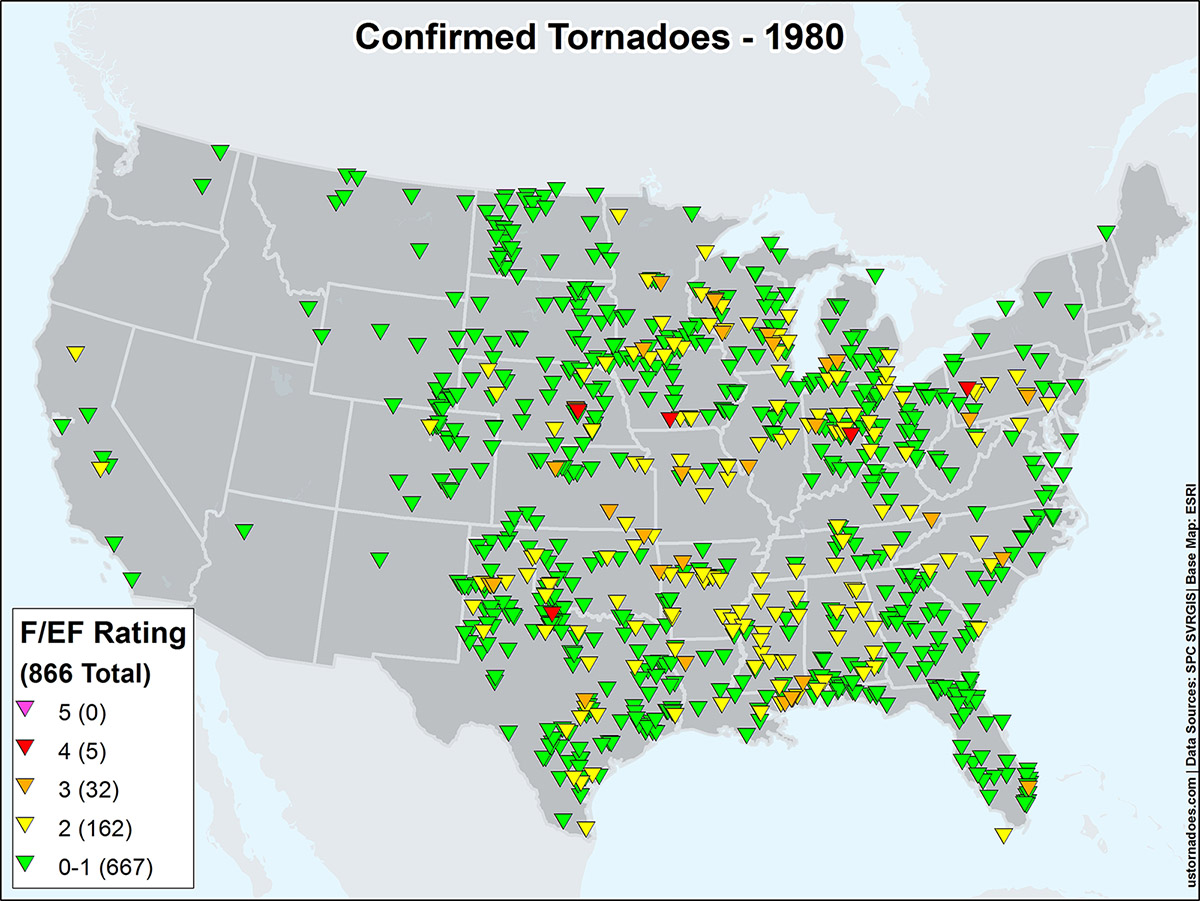
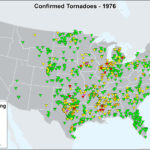
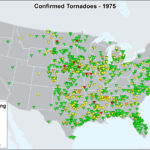
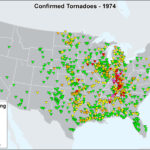
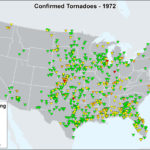
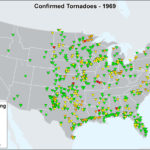
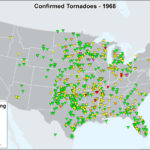
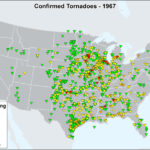
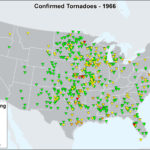
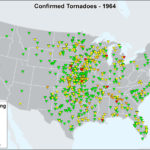
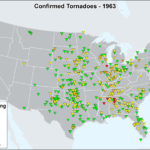
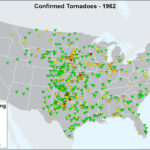
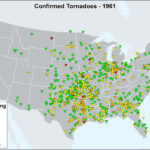
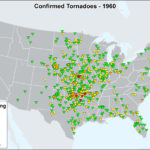
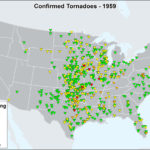
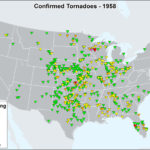
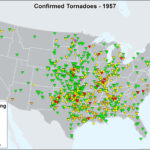
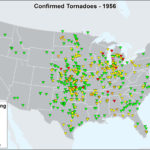
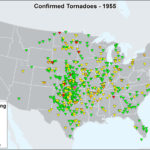
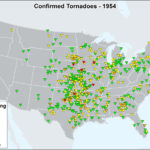
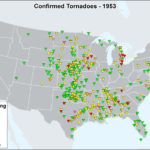
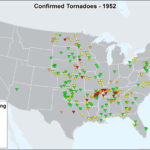
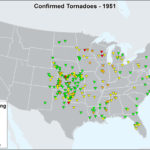
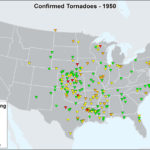
Annual touch down maps, 1950-2016
2010s
2000s
1990s
1980s
1970s
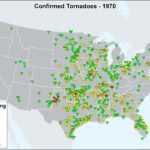
1960s
1950s
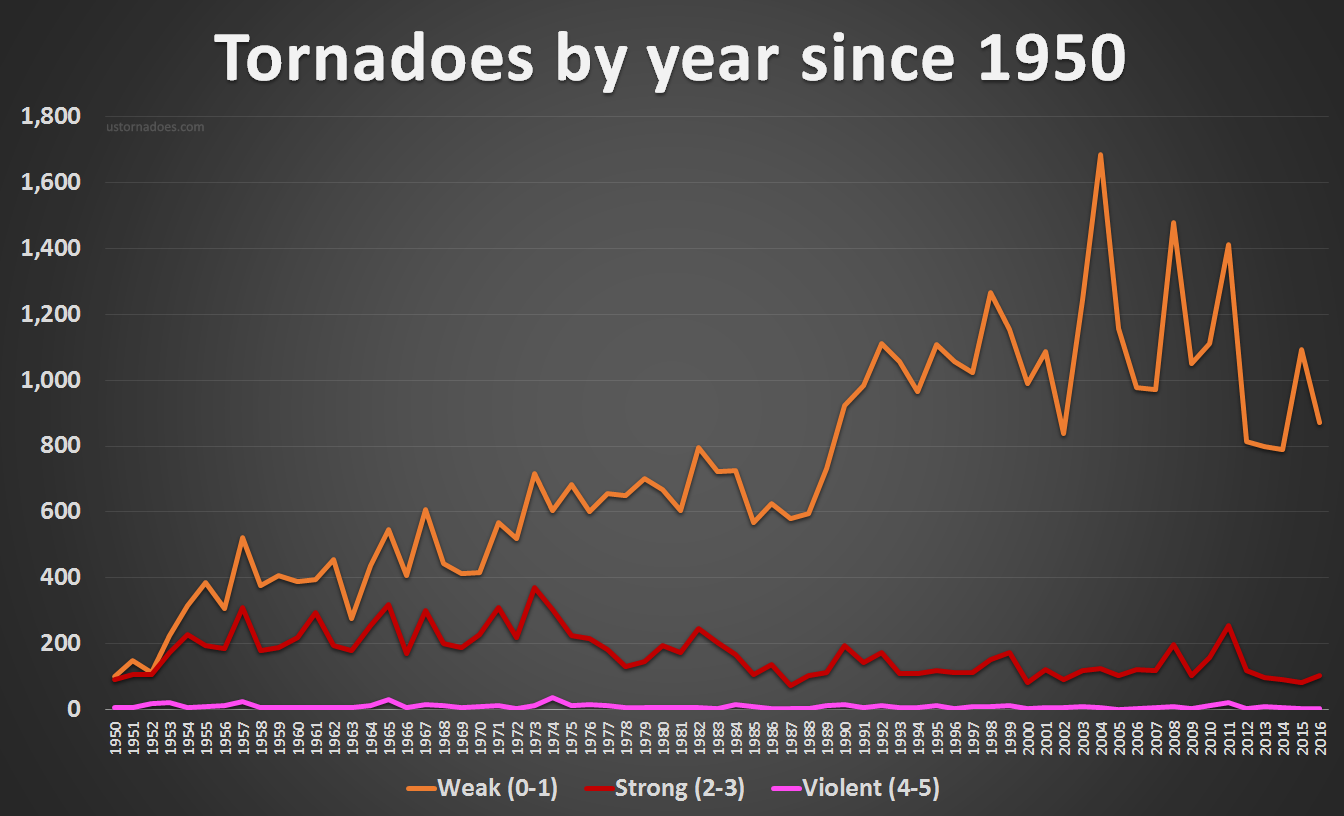
Tornado counts 1950 -2016
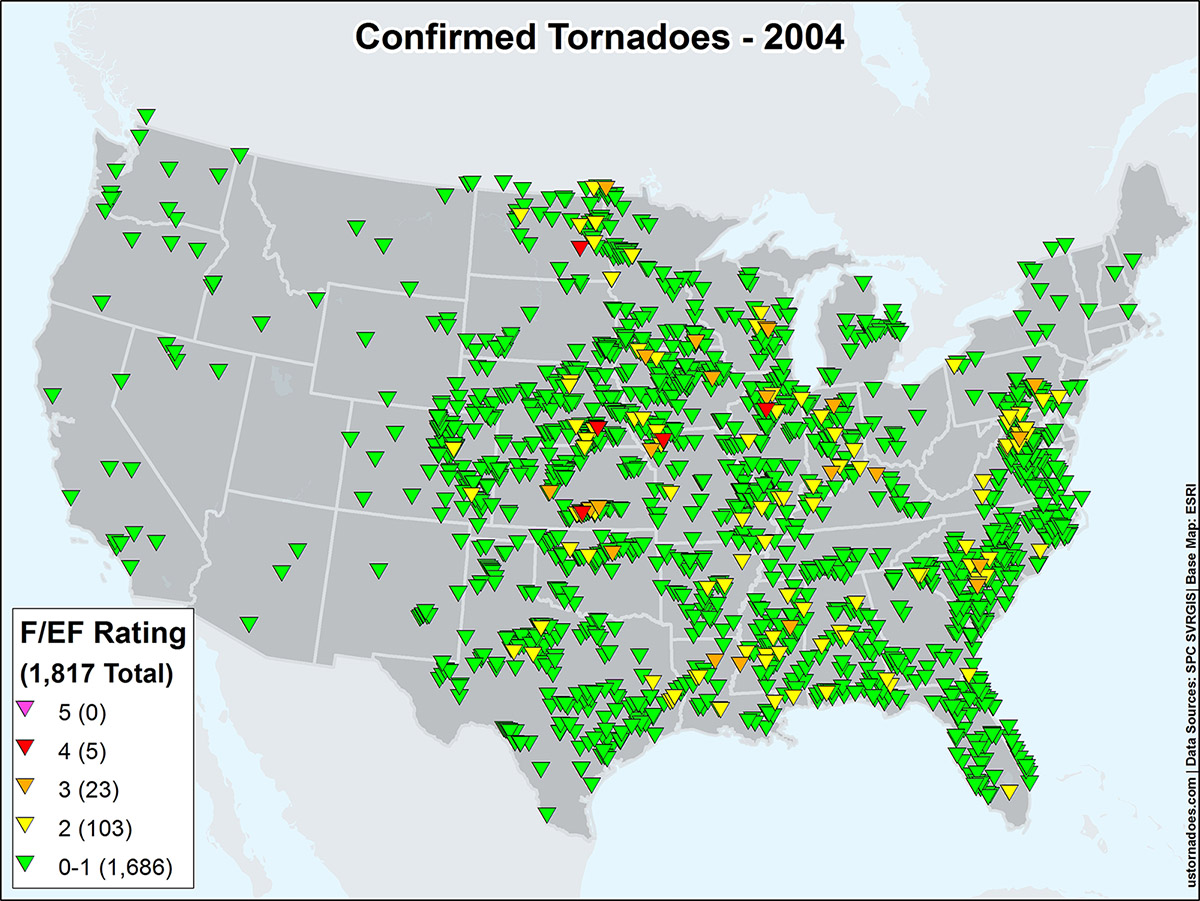
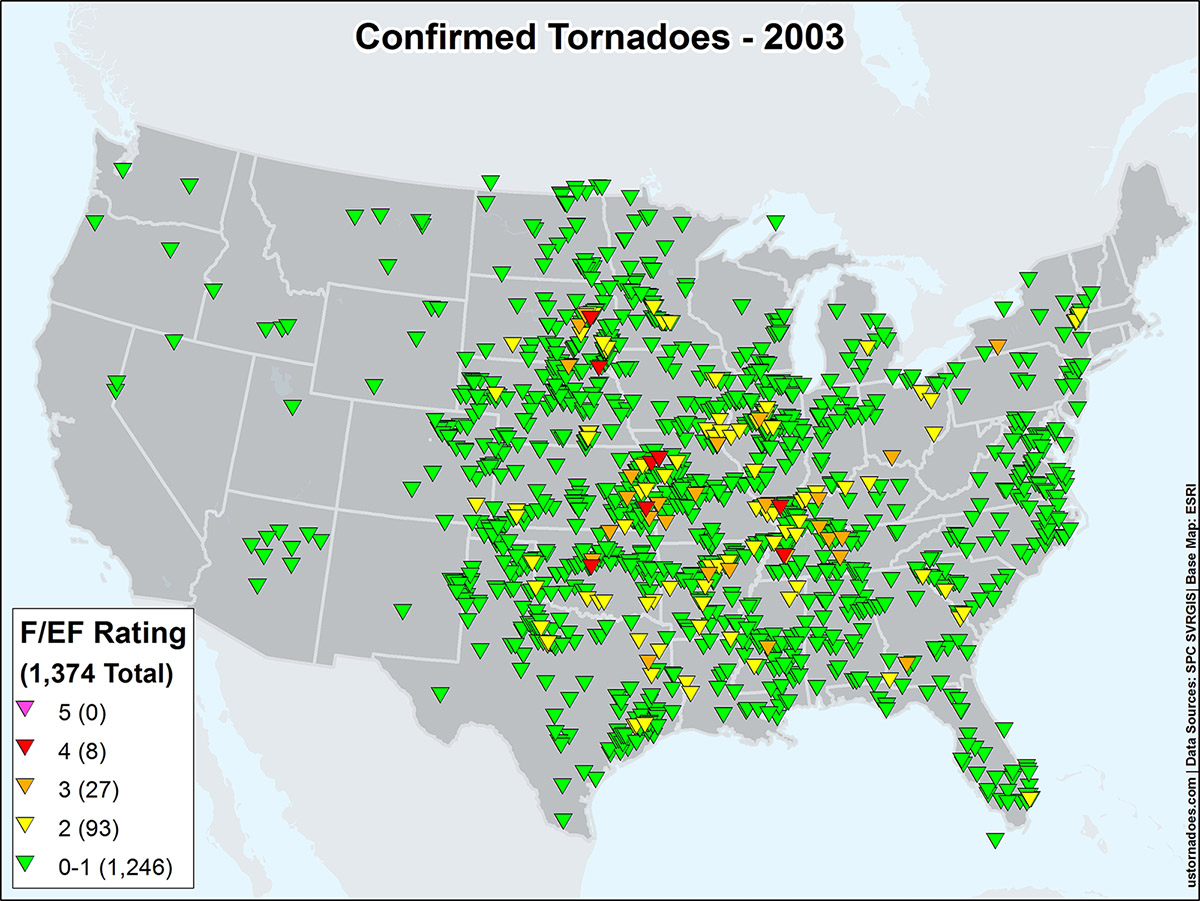
Top 5 years
2004 – 1,817
2011 – 1,691
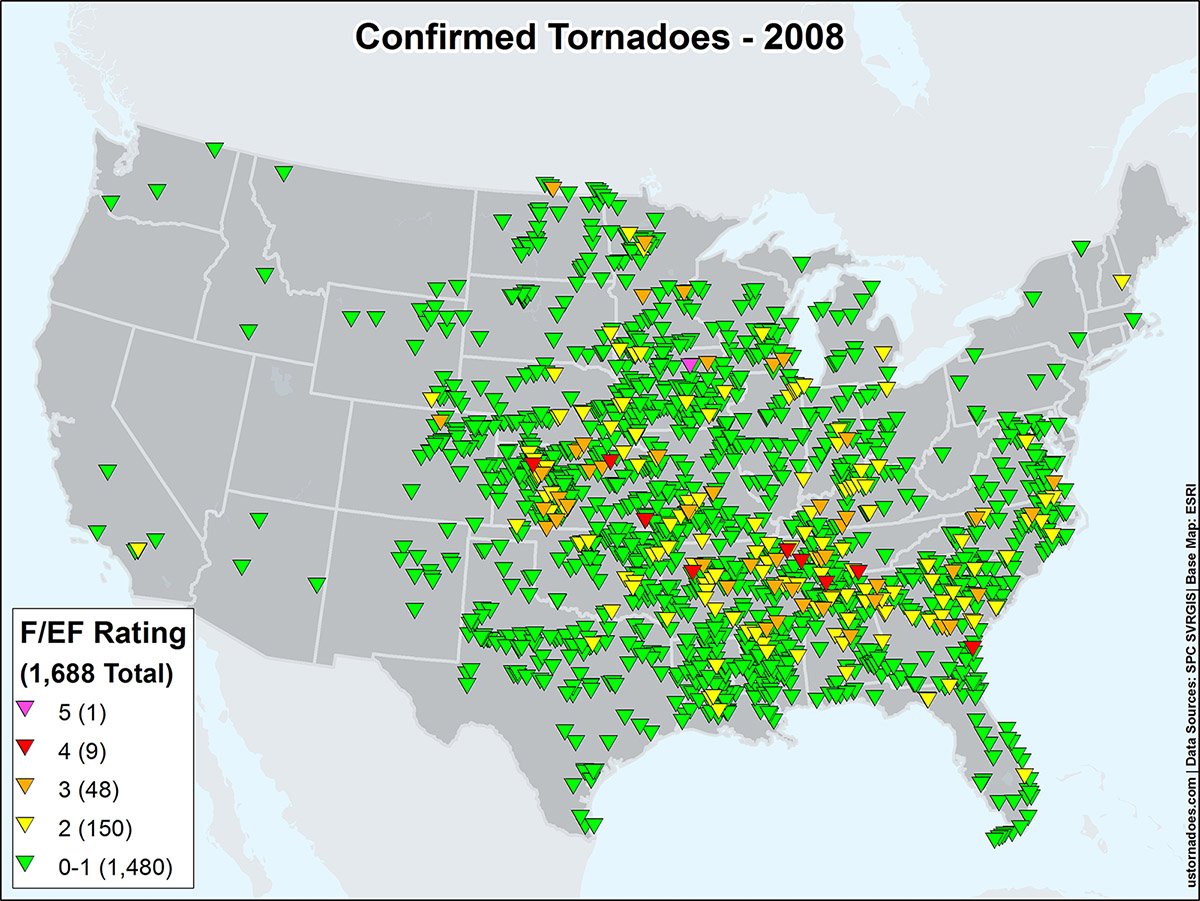
2008 – 1,688
1998 – 1,424
2003 – 1,374
Top 5 Years with most Violent Tornadoes (F/EF 4/5) 626 total
1974 – 38
1965 – 31
1957 – 26
1953 – 22
2011 – 22
Top 5 deadliest years – Total Tornado Deaths: 5,845
2011 – 553
1953 – 523
1974 – 366
1965 – 301
1952 – 230
Tornado records are released in the spring following the end of each year. We will continue to update this post as new data is released. The 2016 data is expected imminently. All data via the Storm Prediction Center.
Katie Wheatley
Latest posts by Katie Wheatley (see all)
- March 29-31, 2022 tornado outbreak - April 3, 2022
- March 25, 2021 tornado outbreak - March 25, 2021
- May 3-4, 1999 tornado outbreak and the Bridge Creek-Moore F5 - May 3, 2019