Ever wondered what the big tornado day is in your state? Wonder no more!
As we’ve mentioned numerous times, no state in the country is totally immune to tornadoes. There are some hot-spots, as we’ll see in the data below. The hot-spots might not all be the ones you typically think of. At the same time, there are not many huge surprises when it comes to which states are in the lead for the biggest tornado day on record. Lots of Plains, lots of Dixie and Southeast, plus lots of Midwest.
Like most things tornado, size matters to some degree, but tornado outbreaks often concentrate their fury on a relatively small region. So size is not quite the dominant force it is on metrics that are derived from data gathered over a longer period of time. With more than six decades in the modern record, calendar day counts in outbreaks do seem to have something of a cap, regardless of where they happen.
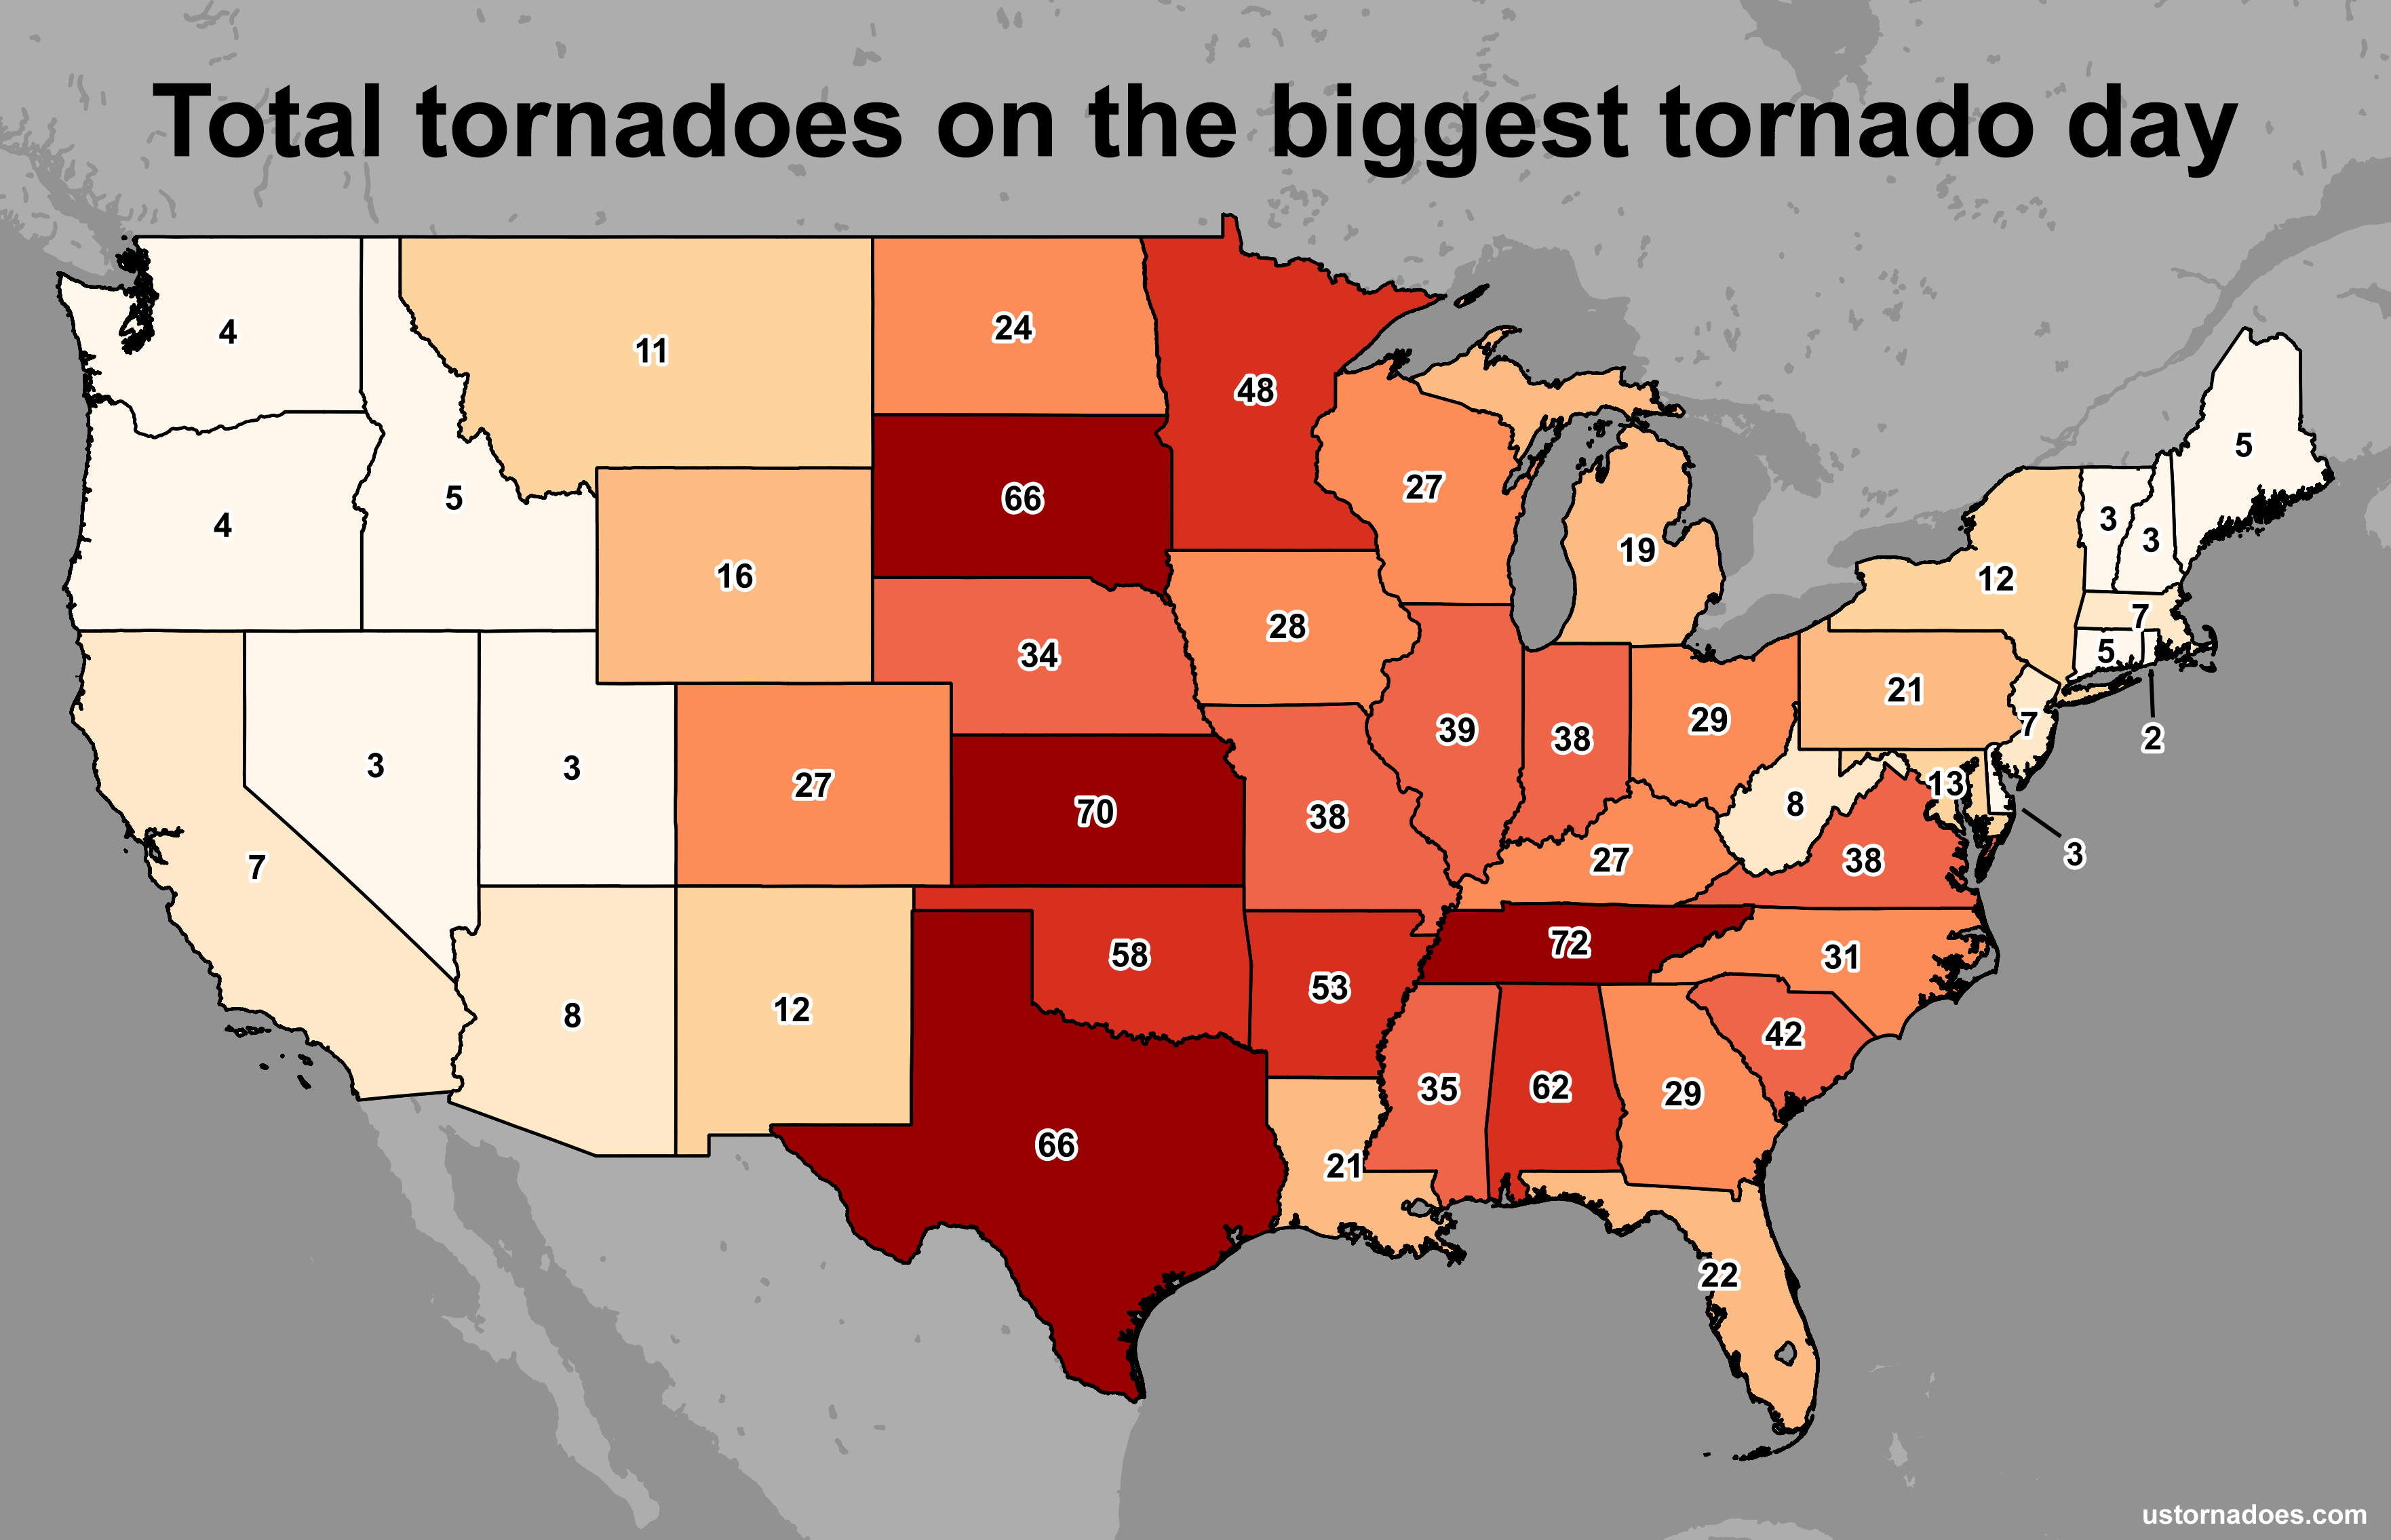
All this in mind, I wouldn’t be surprised if some did not guess Tennessee was the state leader when it comes to tornadoes in one day, with a whopping 72 twisters. This unfathomable number came not too long ago, back during the Super Outbreak of 2011. The records in the states to the south — Mississippi (35 tornadoes) and Alabama (62 tornadoes!) — were also set on April 27 of that year. As we’ll see below, that cluster is a dominant one.
We’ve also got big numbers in the traditional tornado alley states, particularly in Kansas with 70 and Oklahoma at 58. South Dakota may be something of a surprise as well, coming in with 66 tornadoes on it’s most twister-filled day. That’s tied with its hefty cousin to the south, the mega-state of Texas. However, in the case of Texas, those 66 tornadoes came during a tropical system. Hurricane Beulah.
Outside the more typical mid-latitude systems that sweep from west to east across the country throughout the year, tropical systems are a major provider of tornadoes as well. We can see some of their footprint when looking at a map of states ordered by the month in which the top tornado day occurred.
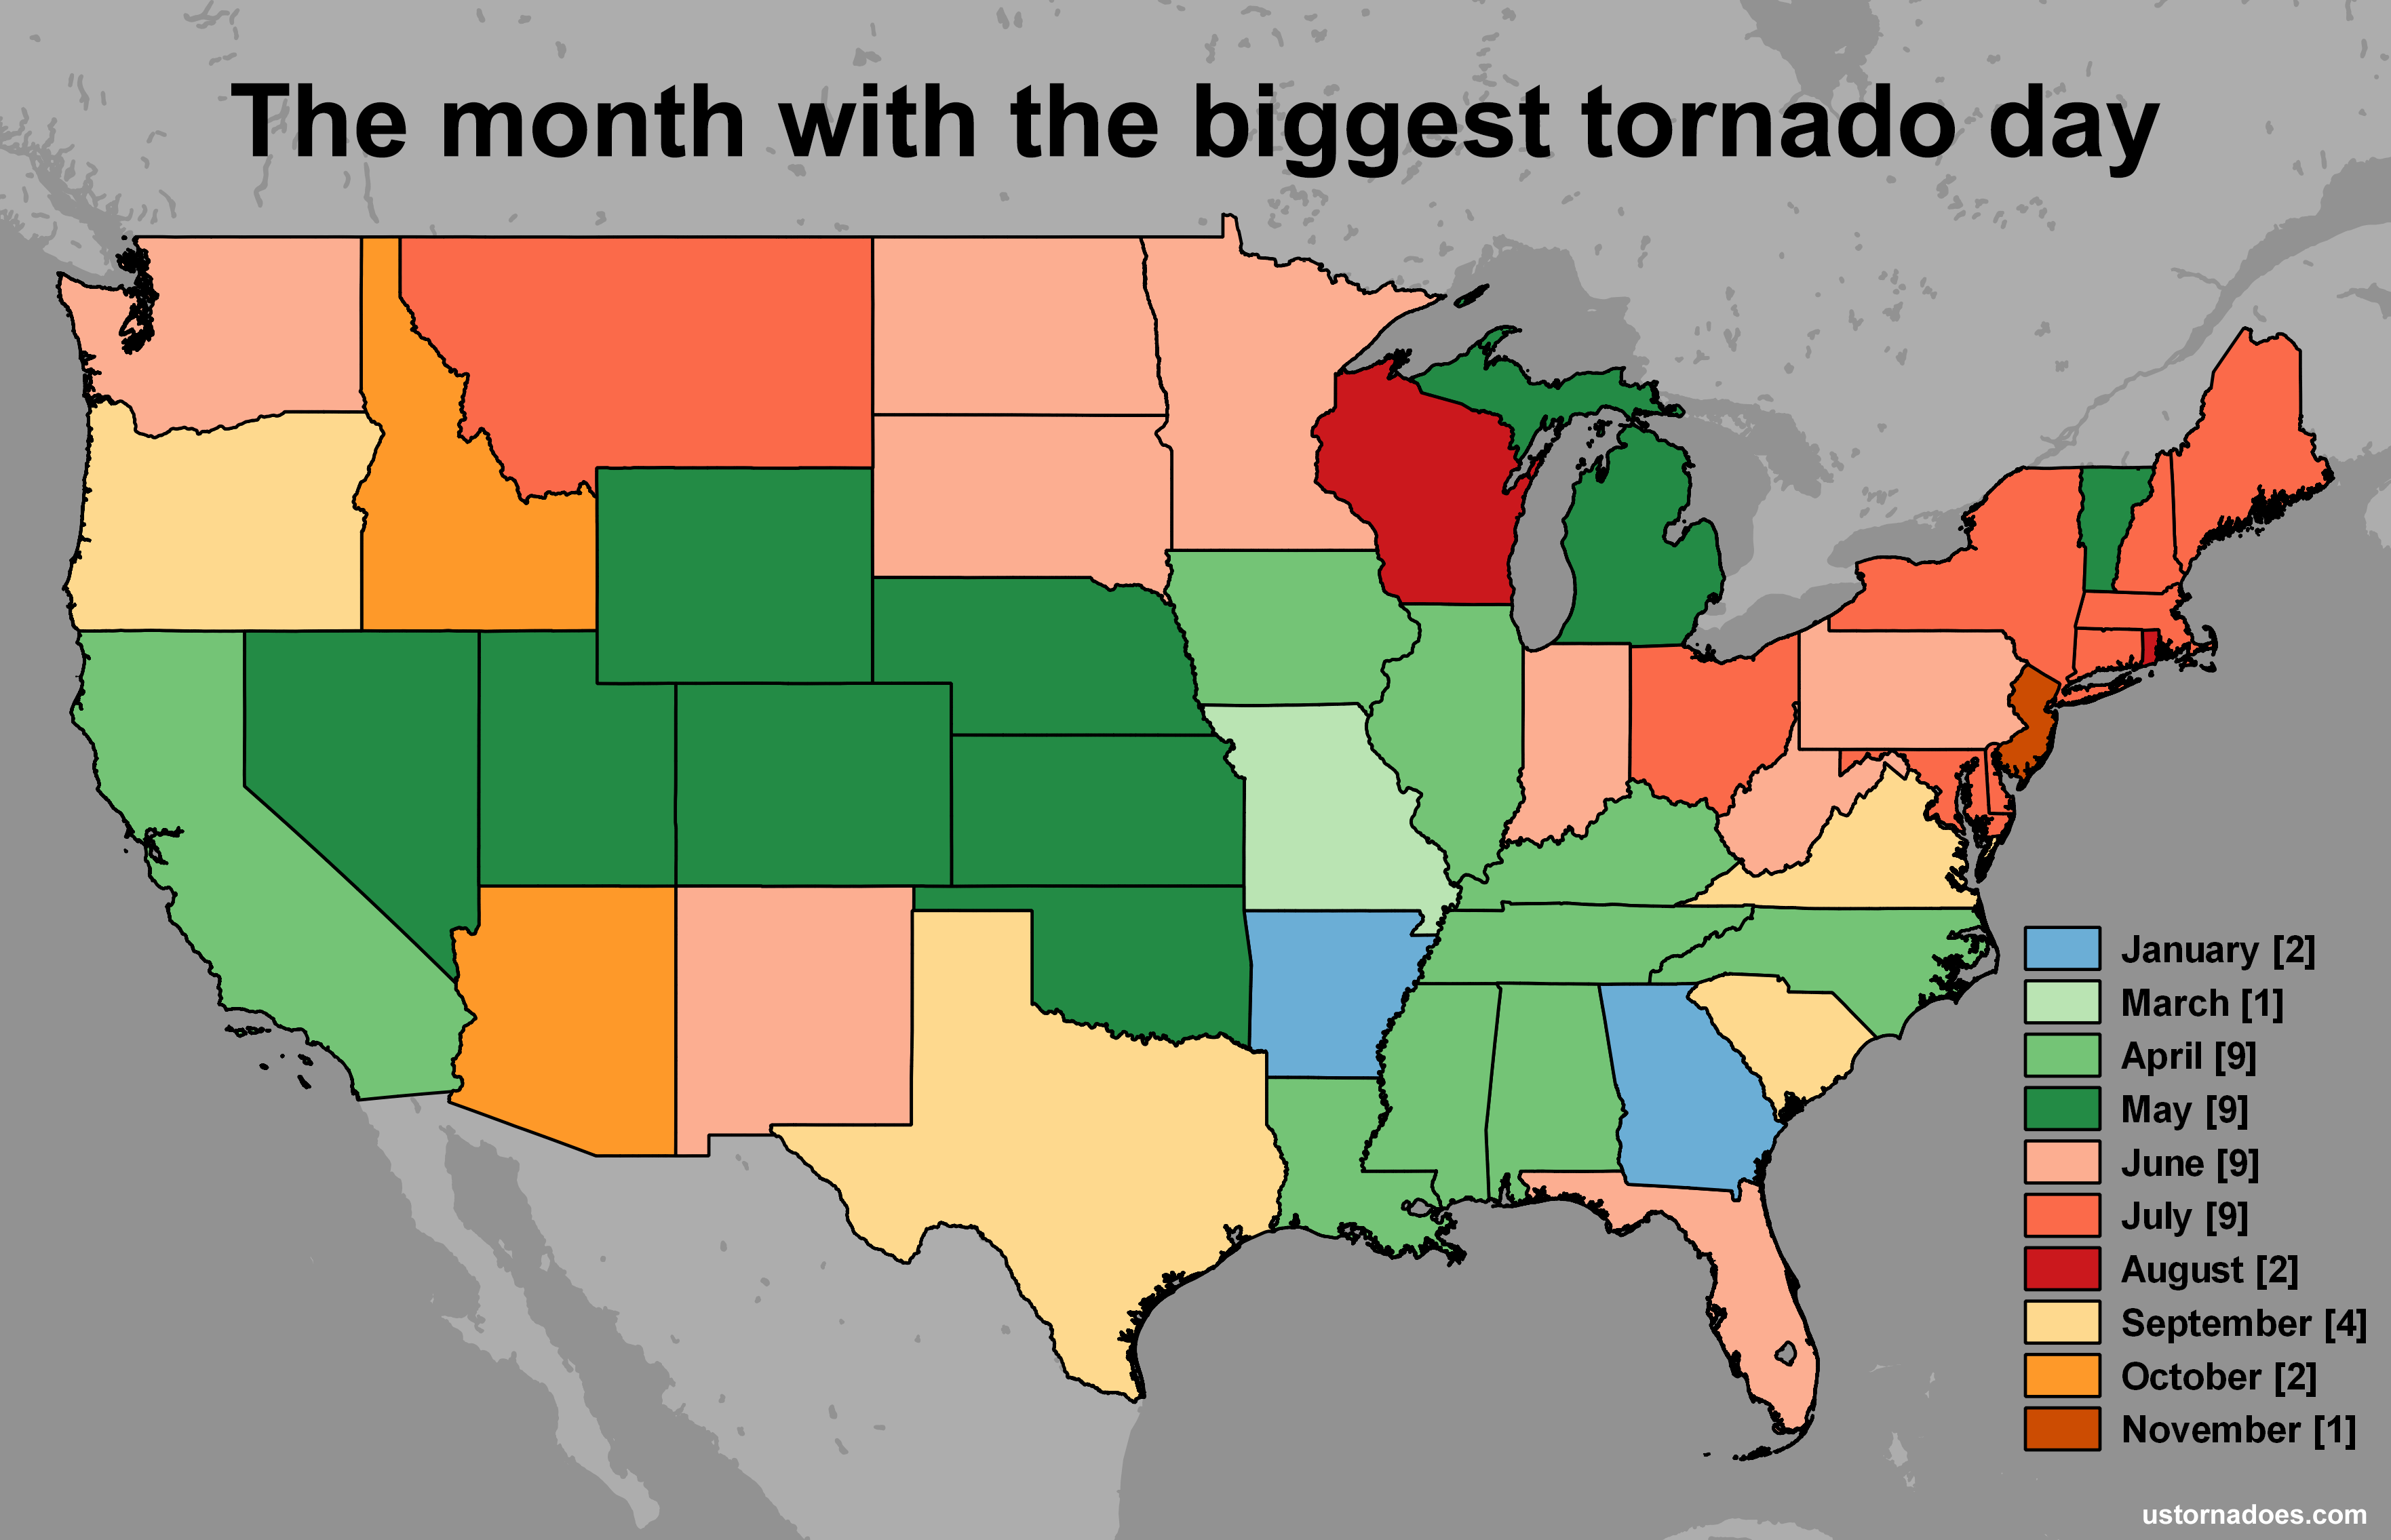
Tornado watchers may immediately notice that Texas is not like the other Plains states. This was explained above. We also see South Carolina and Virginia’s top tornado day being tropical system driven. Delving farther, we can be reminded that not all tropical systems come in late summer or fall. Florida’s record was set by Tropical Storm Debby back in June of 2012. There are also a number of states where a tropical system caused the second biggest tornado day.
Another thing the map above tells us about tornadoes is that they have had their daily peak in every season of the year. While we tend to think of tornado season as a spring thing, if the conditions are present they can happen at any time. Georgia was one place that showed us this last year. It is of course much harder for tornado conditions to be present in winter the farther north one is. As such, most tornado events in that time of year are nearer the warmth of the Gulf of Mexico.
April owns much of the southeastern U.S. As we’ll see below, that is largely thanks to a year or two in recent times. May is the month for the heart of the Plains, but again Texas has that tropical tie-in. Looking to the Northern Tier, it is mostly a case of summer outside the oddball or two in spring. New England and the Mid-Atlantic are dominated by June peak days, and there is a sprinkling of July and even August as well across the larger region that spans coast-to-coast.
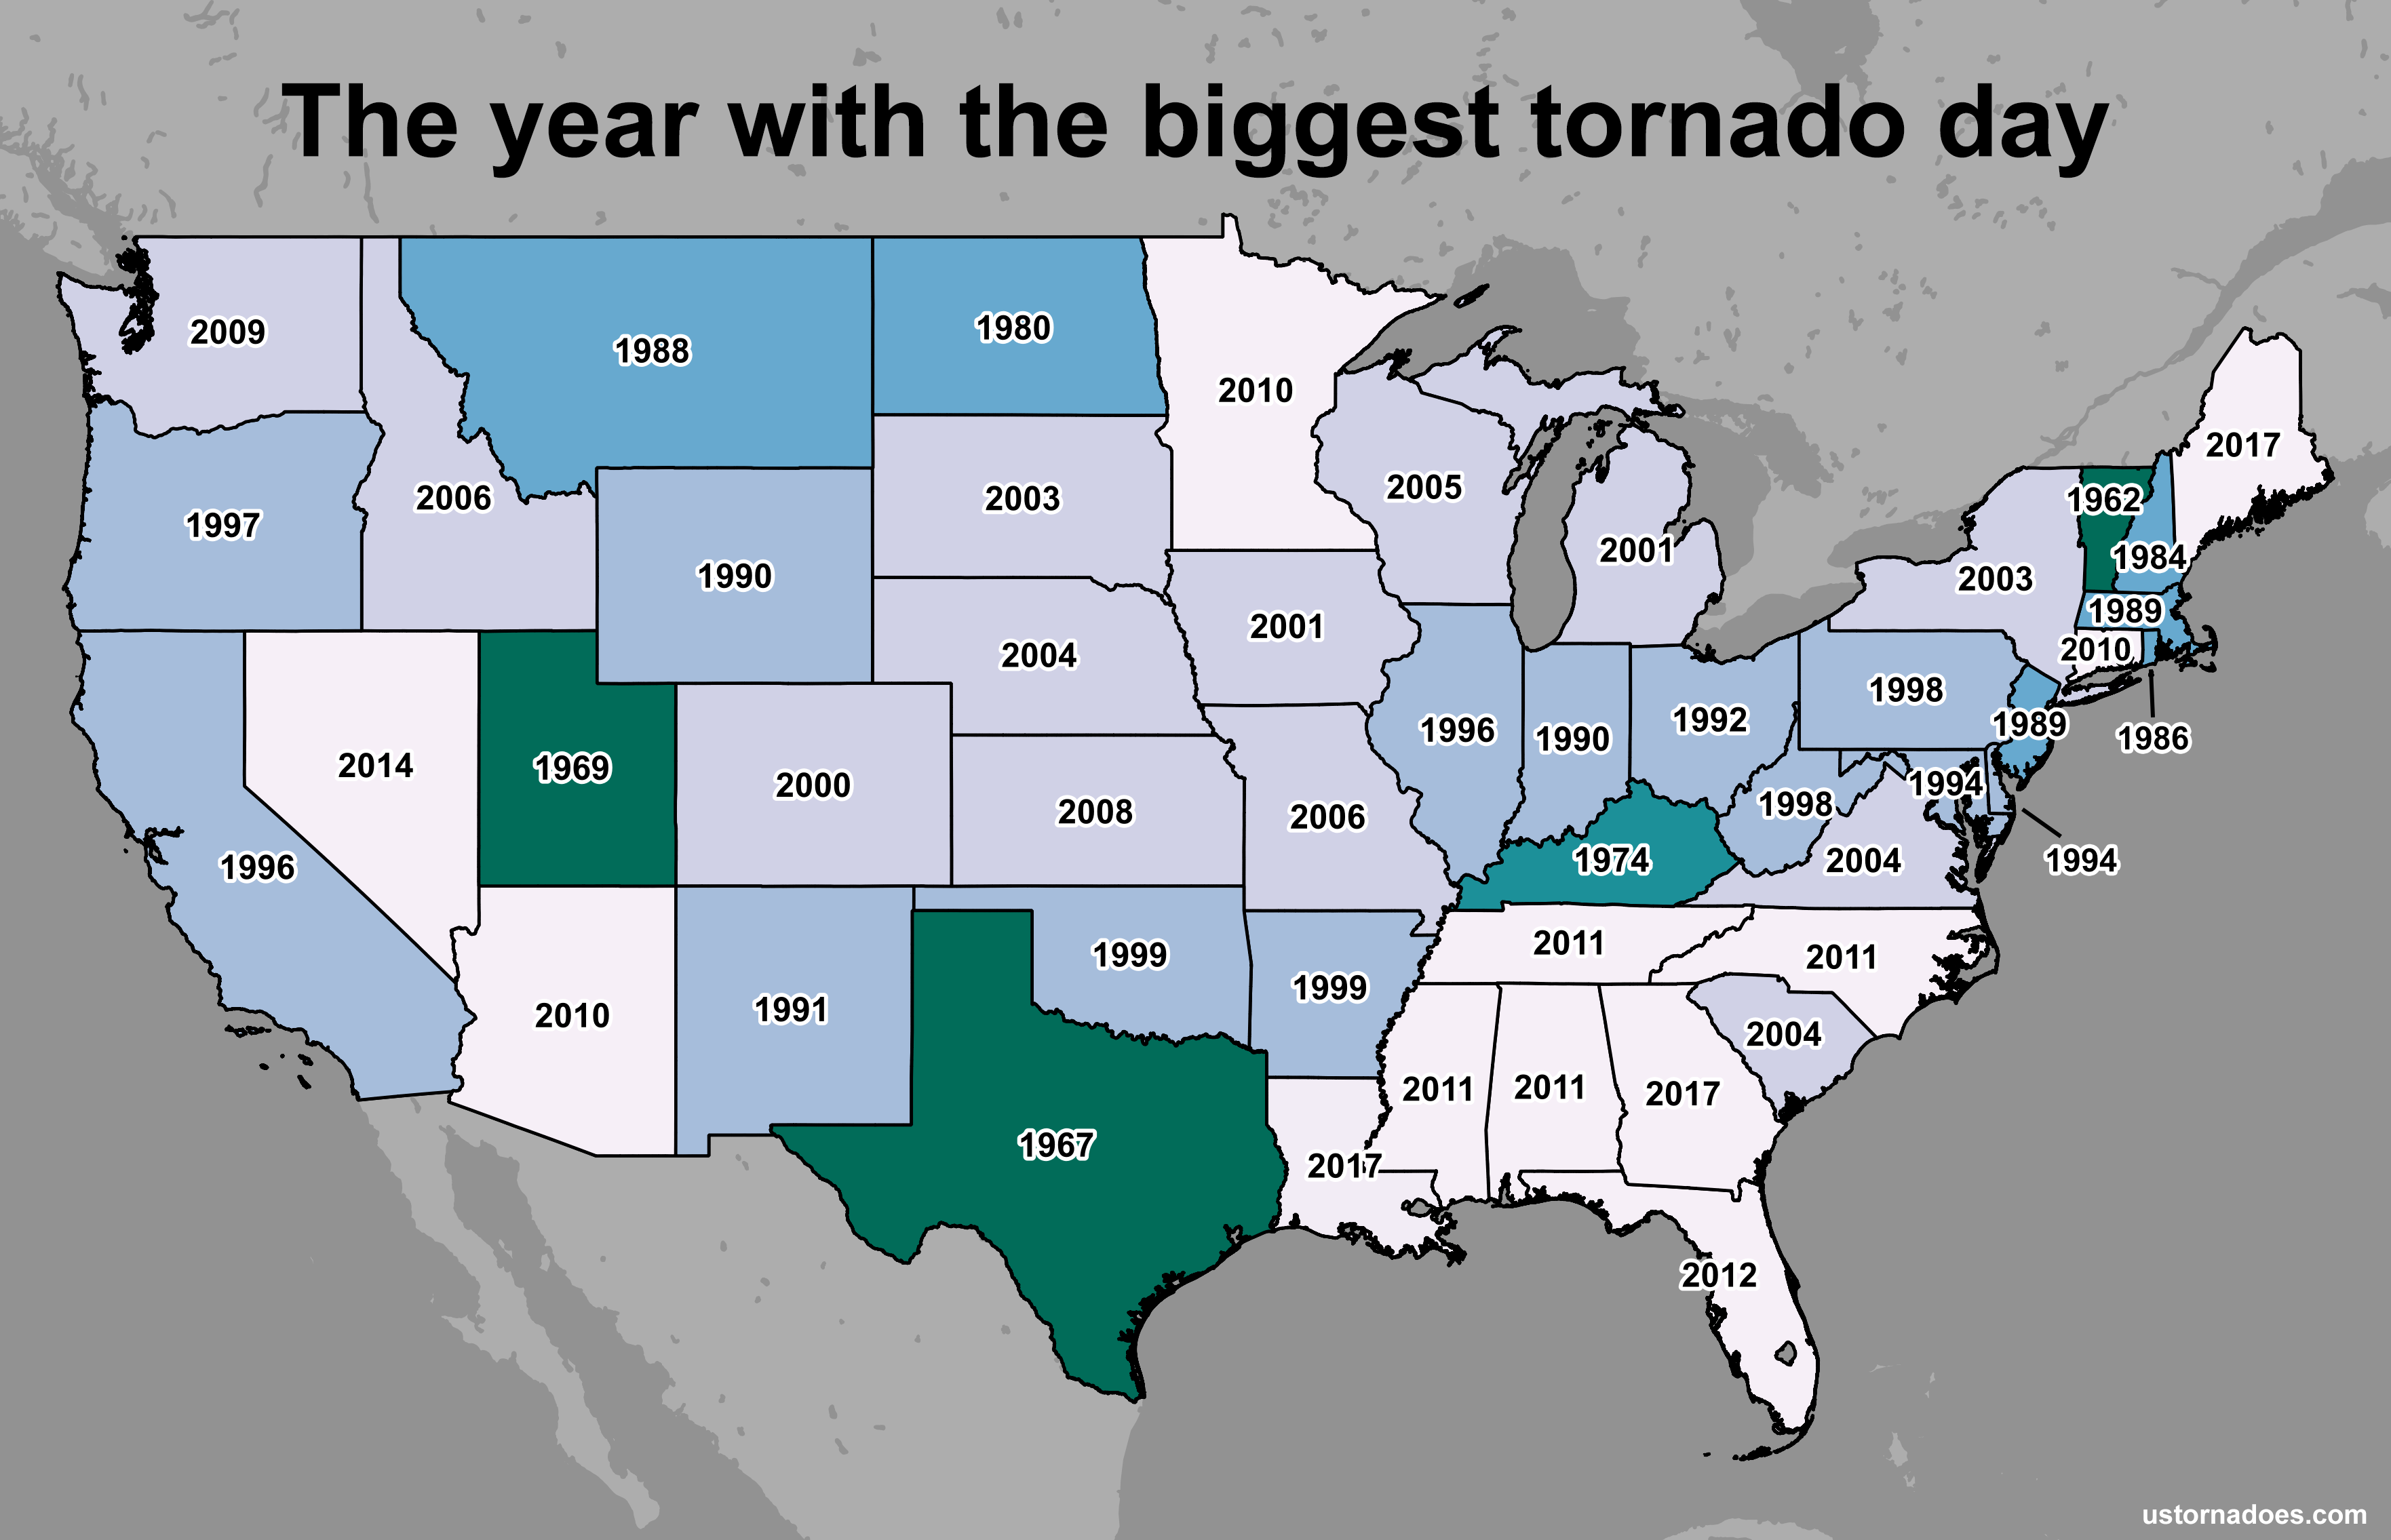
States with a daily tornado record in the 2000s lead our current leader list. 14 of the big days discussed here occurred in that decade. It was certainly a boom for tornado activity on the whole, one which arguably continued through 2011. You’ll note that the Plains and surrounds is a frequent 2000s target, with the central portion of the region showing six different years in that decade alone.
The 1990s and 2010s are next as frequenters for top tornado day, with 13 each (if you include D.C. in the latter). The incredible year of 2011 shows itself well across the South and North Carolina. As recently as 2017, Georgia set a new daily record amidst a seasonal barrage of twisters. As did Louisiana with 21 and Maine also had five tornadoes touch down. The pseudo-state of D.C. saw two quick ones to set its daily record in 2017 as well.
When it comes to time elapsed since the biggest tornado day in each state, the ones that don’t see a ton of tornadoes tend to be the older records. The weird one here is arguably Texas. In its case, the simple fact is that a volley of 66 tornadoes in one calendar day is tough to beat. After glancing across each of the maps here, I am sure there are already some ideas floating around on which state record will be replaced next.
In cases where there are ties in the record, the most recent is shown here. For now, this is through 2017, and 2017 numbers are subject to revision. The numbers and corresponding data were initially gathered using SPC shapefiles (through 2016) cropped to states in GIS. After publish I was pointed to the SPC .csv preliminary file for 2017, which allowed me to correct and add two new entries for 2017 (LA and ME). As with all data analysis, is not impossible there is some slight discrepancy in a spot or two compared to other sources. We are happy to address any questions that may arise, so please let us know. We will continue to update this post as we go.
Top tornado day details
| State | Tornadoes | Date | Year | Decade | Month |
|---|---|---|---|---|---|
| AL | 62 | 4/27/2011 | 2011 | 2010s | April |
| AR | 53 | 1/21/1999 | 1999 | 1990s | January |
| AZ | 8 | 10/6/2010 | 2010 | 2010s | October |
| CA | 7 | 4/1/1996 | 1996 | 1990s | April |
| CO | 27 | 5/17/2000 | 2000 | 2000s | May |
| CT | 5 | 7/21/2010 | 2010 | 2010s | July |
| DE | 3 | 7/27/1994 | 1994 | 1990s | July |
| FL | 22 | 6/24/2012 | 2012 | 2010s | June |
| GA | 29 | 1/21/2017 | 2017 | 2010s | January |
| IA | 28 | 4/11/2001 | 2001 | 2000s | April |
| ID | 5 | 10/4/2006 | 2006 | 2000s | October |
| IL | 39 | 4/19/1996 | 1996 | 1990s | April |
| IN | 38 | 6/2/1990 | 1990 | 1990s | June |
| KS | 70 | 5/23/2008 | 2008 | 2000s | May |
| KY | 27 | 4/3/1974 | 1974 | 1970s | April |
| LA | 21 | 4/2/2017 | 2017 | 2010s | April |
| MA | 7 | 7/10/1989 | 1989 | 1980s | July |
| MD | 13 | 7/27/1994 | 1994 | 1990s | July |
| ME | 5 | 7/1/2017 | 2017 | 2010s | July |
| MI | 19 | 5/21/2001 | 2001 | 2000s | May |
| MN | 48 | 6/17/2010 | 2010 | 2010s | June |
| MO | 38 | 3/12/2006 | 2006 | 2000s | March |
| MS | 35 | 4/27/2011 | 2011 | 2010s | April |
| MT | 11 | 7/5/1988 | 1988 | 1980s | July |
| NC | 31 | 4/16/2011 | 2011 | 2010s | April |
| ND | 24 | 6/4/1980 | 1980 | 1980s | June |
| NE | 34 | 5/22/2004 | 2004 | 2000s | May |
| NH | 3 | 7/5/1984 | 1984 | 1980s | July |
| NJ | 7 | 11/16/1989 | 1989 | 1980s | November |
| NM | 12 | 6/6/1991 | 1991 | 1990s | June |
| NV | 3 | 5/21/2014 | 2014 | 2010s | May |
| NY | 12 | 7/21/2003 | 2003 | 2000s | July |
| OH | 29 | 7/12/1992 | 1992 | 1990s | July |
| OK | 58 | 5/3/1999 | 1999 | 1990s | May |
| OR | 4 | 9/15/1997 | 1997 | 1990s | September |
| PA | 21 | 6/2/1998 | 1998 | 1990s | June |
| RI | 2 | 8/7/1986 | 1986 | 1980s | August |
| SC | 42 | 9/7/2004 | 2004 | 2000s | September |
| SD | 66 | 6/24/2003 | 2003 | 2000s | June |
| TN | 72 | 4/27/2011 | 2011 | 2010s | April |
| TX | 66 | 9/20/1967 | 1967 | 1960s | September |
| UT | 3 | 5/31/1969 | 1969 | 1960s | May |
| VA | 38 | 9/17/2004 | 2004 | 2000s | September |
| VT | 3 | 5/20/1962 | 1962 | 1960s | May |
| WA | 4 | 6/6/2009 | 2009 | 2000s | June |
| WI | 27 | 8/18/2005 | 2005 | 2000s | August |
| WV | 8 | 6/2/1998 | 1998 | 1990s | June |
| WY | 16 | 5/24/1990 | 1990 | 1990s | May |
| HI | 2 | 2/11/1982 | 1982 | 1980s | February |
| AK | 1 | 7/25/2005 | 2005 | 2000s | July |
| DC | 2 | 4/6/2017 | 2017 | 2010s | April |
Latest posts by Ian Livingston (see all)
- Tornado outbreaks: April, May and June peak-season primer - April 27, 2025
- Busy March for twisters to end with another multi-day event - March 28, 2025
- Everything but locusts: NWS shines in apocalyptic weather - March 17, 2025