
Roughly 20 percent of the 12,349 tornadoes in May (1950-2011) were significant. That’s a hard count of 2,435 tornadoes. Since these are the tornadoes that cause the overwhelming majority of loss from tornadic activity, they are worth examining separate from the larger group that is weighted heavily toward weak events.
May Significant Tornado Stats (1950-2011)
Total significant tornadoes: 2,435
May high: 97 (1965)
May low: 6 (2005)
1991-2010 average: 30.0
Overall, May has fairly steady and regular significant tornado activity, though there are notably low and notably high years in the record. If anything, it appears that recent decades have had lower numbers than those in the first half of the 1950-2011 time frame. The two lowest May significant tornado numbers occurred since 1994. However, higher ratings were arguably at one time easier to come by, so it’s difficult to make a direct comparison.
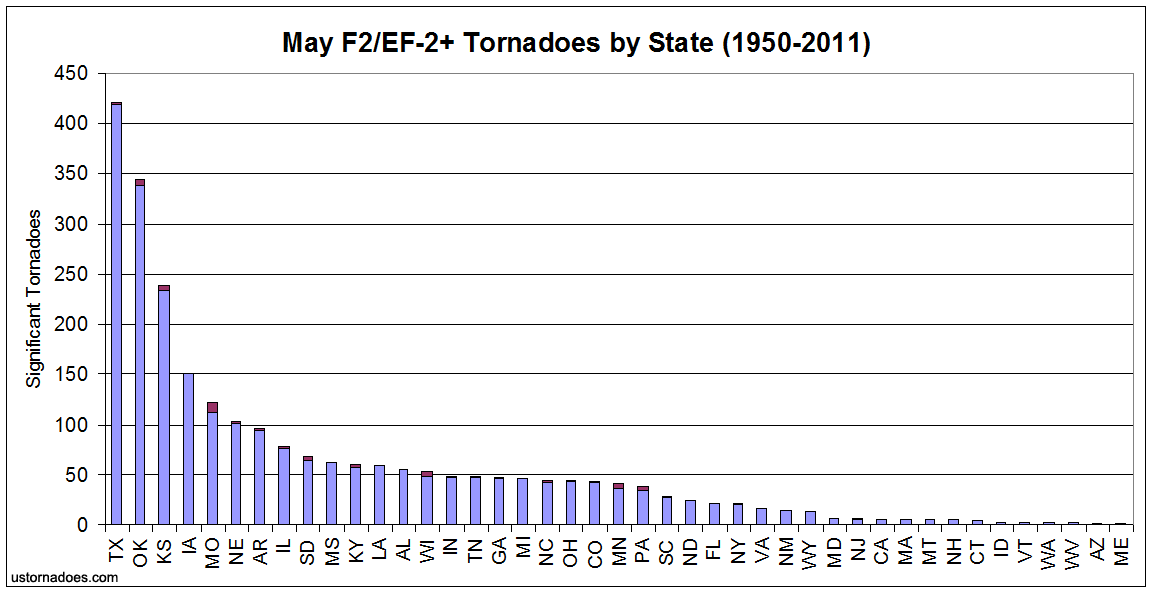
As seen in the map showing May tornadoes by county, and the overall count in tornadoes, significant tornado activity in May heavily favors the Plains. Increased activity continues east from that hotspot into portions of the Midwest. End of peak season areas of the South round out the top overall spots.
For the most part, the state order for significant tornadoes matches fairly closely to that of the overall May numbers. Interestingly, Oklahoma shows a markedly higher percentage of significant tornadoes to overall tornadoes in May compared to Texas and Kansas. About 26 percent of May tornadoes from 1950-2011 reached this category in Oklahoma compared to 18 percent in the states north and south.
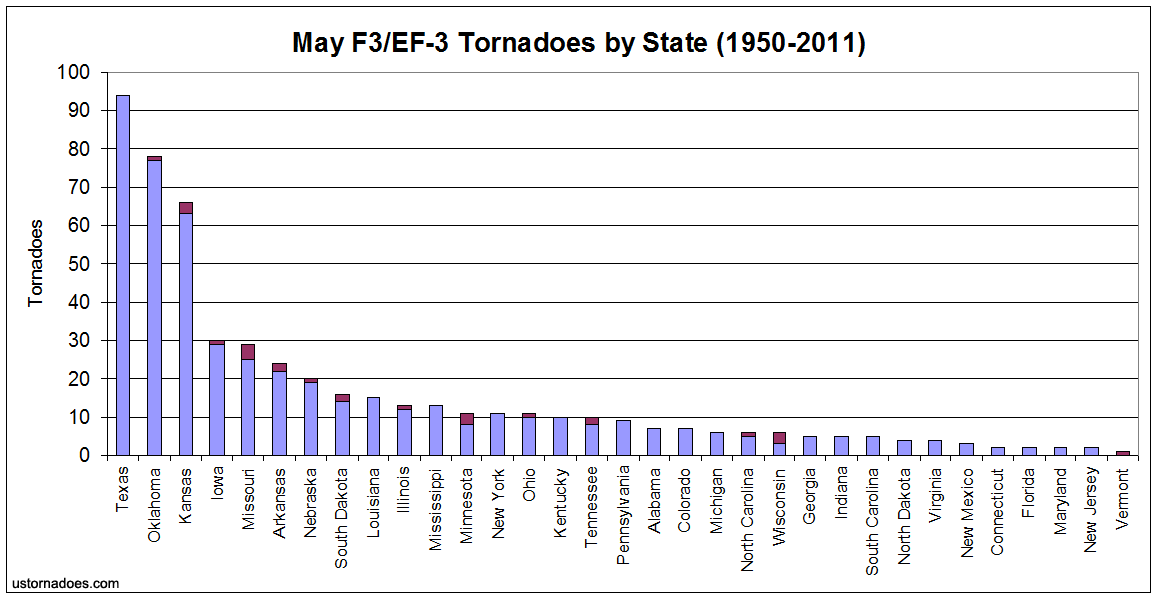
The gap between Texas’ overall lead and that of smaller states around it drops further as we look at F3/EF-3 tornadoes. Zones more likely to face the brunt of major severe episodes just to the north of Texas, in Oklahoma and Kansas, continue their category rises. Behind these three leaders, Iowa and Missouri round out the top-5 for F3/EF-3s.
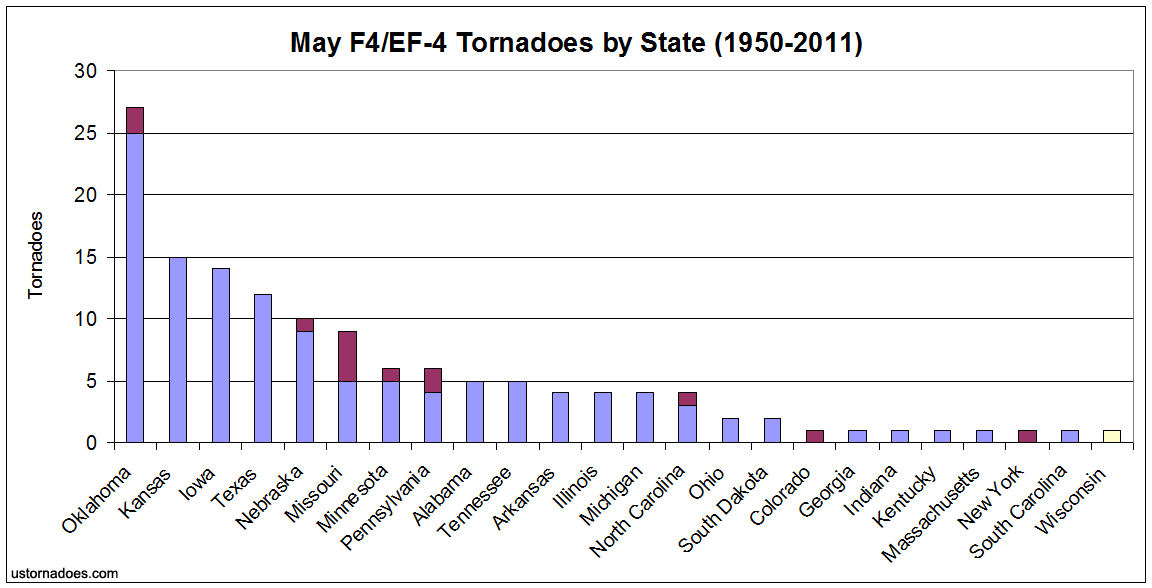
By the first state of violent tornadoes in May, Texas loses its top spot and Oklahoma holds a commanding lead over Kansas. Texas, which held the top spot through previous counts, falls to fourth on this list behind Iowa. Perhaps a surprise on the chart is Pennsylvania. However, all of these violent tornadoes came on May 31, 1985, in addition to the F5 that passed into the state from Ohio.
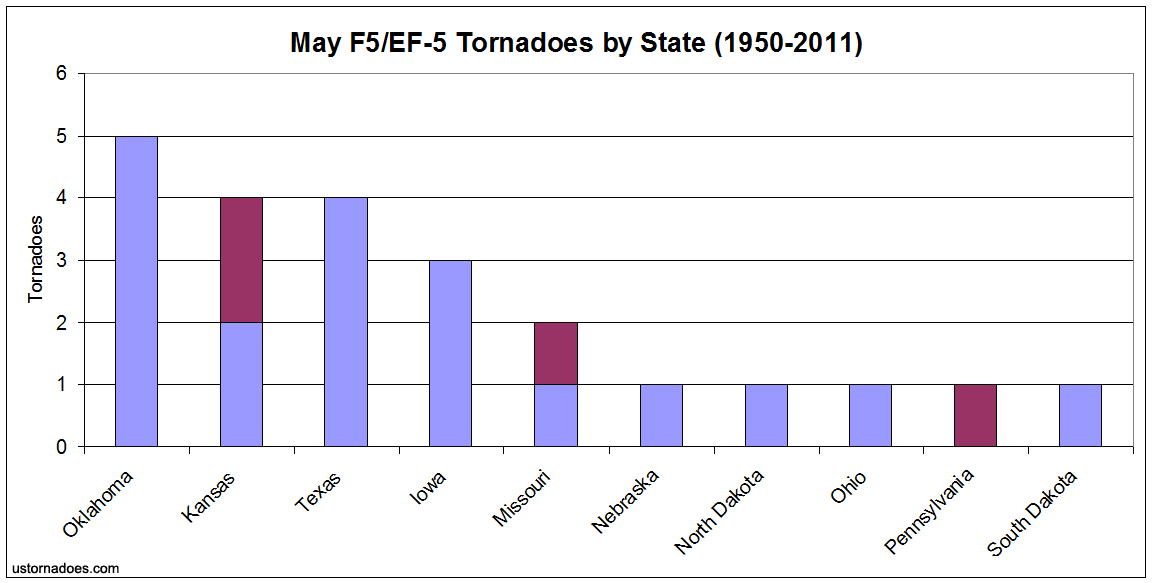
Raw F5/EF-5 numbers peak in April, though May leads when it comes to days having them, thanks to April’s proliferation of such events in outbreaks. Oklahoma has been impacted by five of these most violent tornadoes in May, most recently in 2011. Kansas and Texas have been hit by four each, and Iowa three. The other state hit by an EF-5 in May 2011, Missouri, rounds out the top-5 with two.
Latest posts by Ian Livingston (see all)
- Tornado outbreaks: April, May and June peak-season primer - April 27, 2025
- Busy March for twisters to end with another multi-day event - March 28, 2025
- Everything but locusts: NWS shines in apocalyptic weather - March 17, 2025
One thought on “Significant May Tornadoes in the United States”