April is the most volatile month for tornadoes. Plenty of years feature not a ton of activity, but there is also seemingly unlimited high-end outbreak potential. Two events since the modern record began in 1950 stand out above all the others in this category: The Super Outbreaks of April 3-4, 1974 and April 25-28, 2011.
Related: April 2011 Super Outbreak | April 1974 Super Outbreak
Event Similarities
Outside tornado alley:
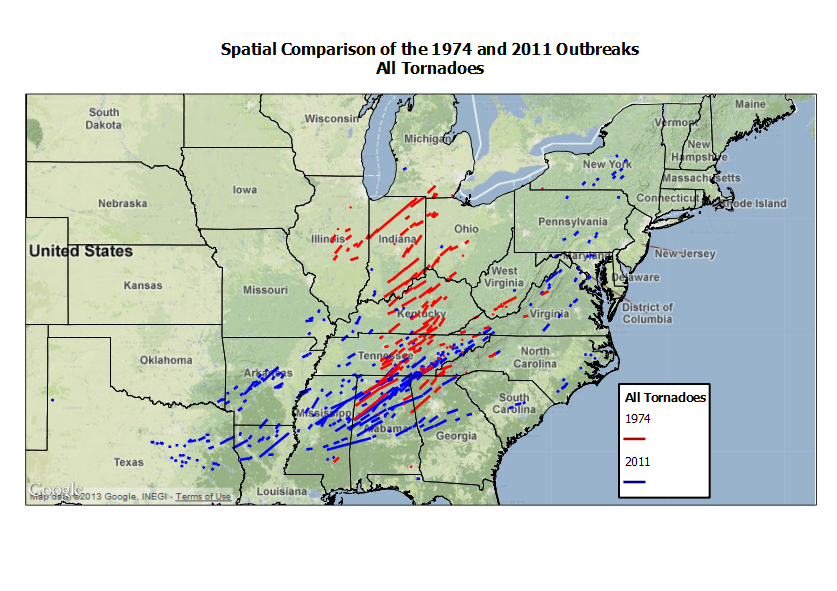
Both events were similar in that they did not occur over the storied Plains-centric Tornado Alley, but rather throughout the Midwest, Lower Mississippi Valley, and Southeast.
Tennessee:
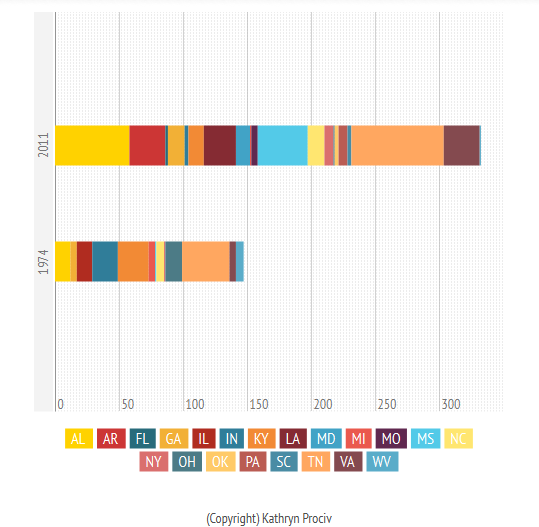
Another similarity between the two events was that the state of Tennessee experienced the most tornadoes in both events. Yes, both!

Even though the April 1974 outbreak had a more northerly bias spanning across the Midwest, and the April 2011 outbreak a more southern bias, Tennessee was the geographic center for both.
Event Differences
Duration:
The April 2011 outbreak lasted much longer at three days and seven hours as opposed to just 18 hours during the April 1974 outbreak.
Total number of tornadoes:
The April 1974 outbreak featured 148 total tornadoes and 350 dropped in 2011. However due to the fact that 2011 was a continuous three-day outbreak, it should be no surprise it triggered two-in-a-half times as many tornadoes as 1974! It’s also more than likely that tornadoes were missed in 1974 that are counted today.
Number of major tornadoes (F/EF3-F/EF5):
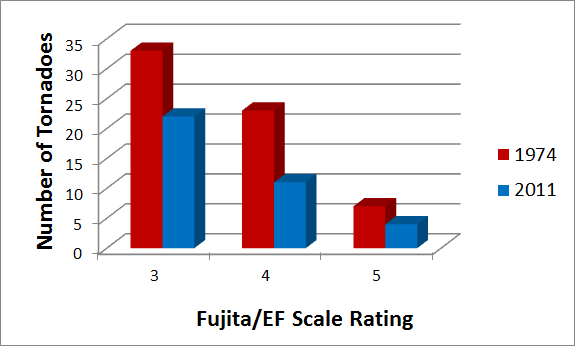
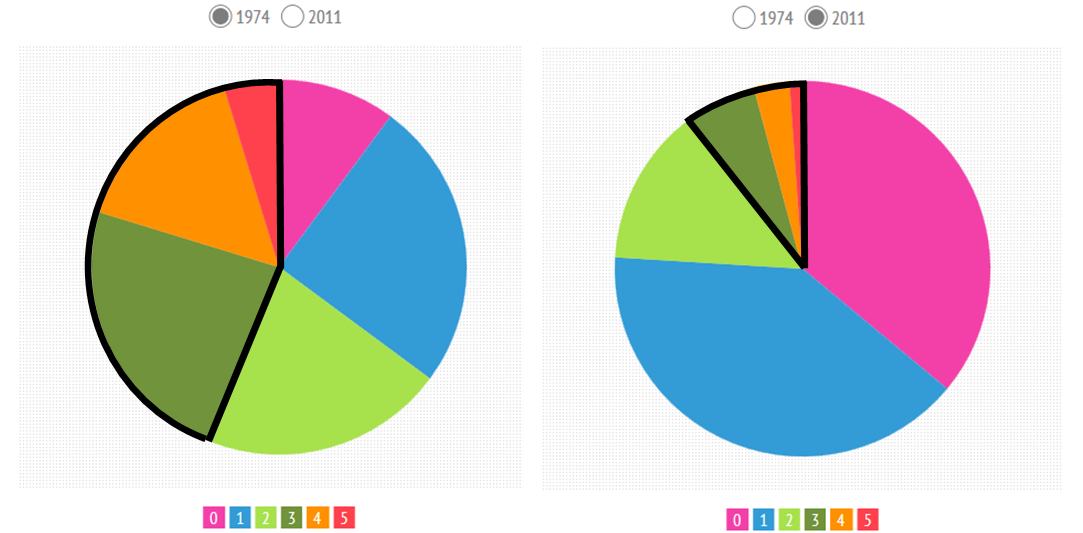
Where 2011 outscored 1974 in terms of total number of tornadoes, 1974 made up for with the number of what I’ll call “major” tornadoes, or F/EF3-F/EF5. You may remember the next graph from an article earlier this month for the anniversary of the 1974 outbreak:
And here is a map of only F/EF 3-F/EF5 tornadoes from the two events:
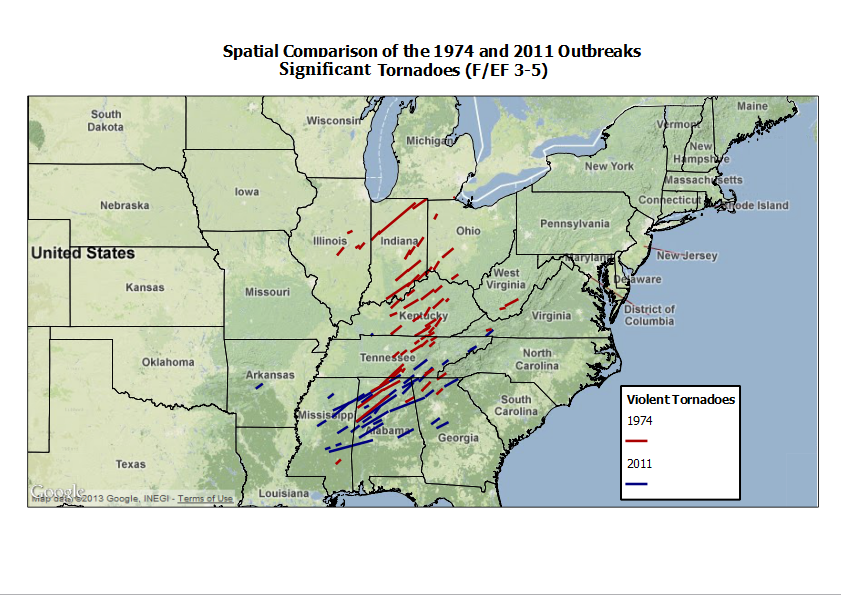
If Tennessee is the hardest state overall, then Alabama comes in second as the hardest hit state with the most total F/EF 3+ tornadoes from both events combined.
1974 featured 65 tornadoes of F3 strength or higher, meaning these tornadoes made up 44% of the total number of tornadoes. 2011 had 37 tornadoes of EF3 strength or higher, making up just 11% of the total number of tornadoes in the significant category. A big difference! Partly due to the huge number of EF0/EF1 tornadoes in April 2011.
Geographic epicenter:
At the beginning of the article it was discussed that while both events took place across relatively the same broad regions of the Midwest, lower Mississippi valley, and Southeast. However, the April 3-4, 1974 had a much more northerly bias to the event, whereas the highest concentration of tornadoes occurred farther south during the April 25-28, 2011 outbreak. One way to visualize this is by looking at the overall tornado track maps for both events (map shown above).
Another way is to visualize is using a density, or heat map. Making a heat map for each event, then overlaying them on top of one another allowed for the visualization of where the epicenters for each event were centered:
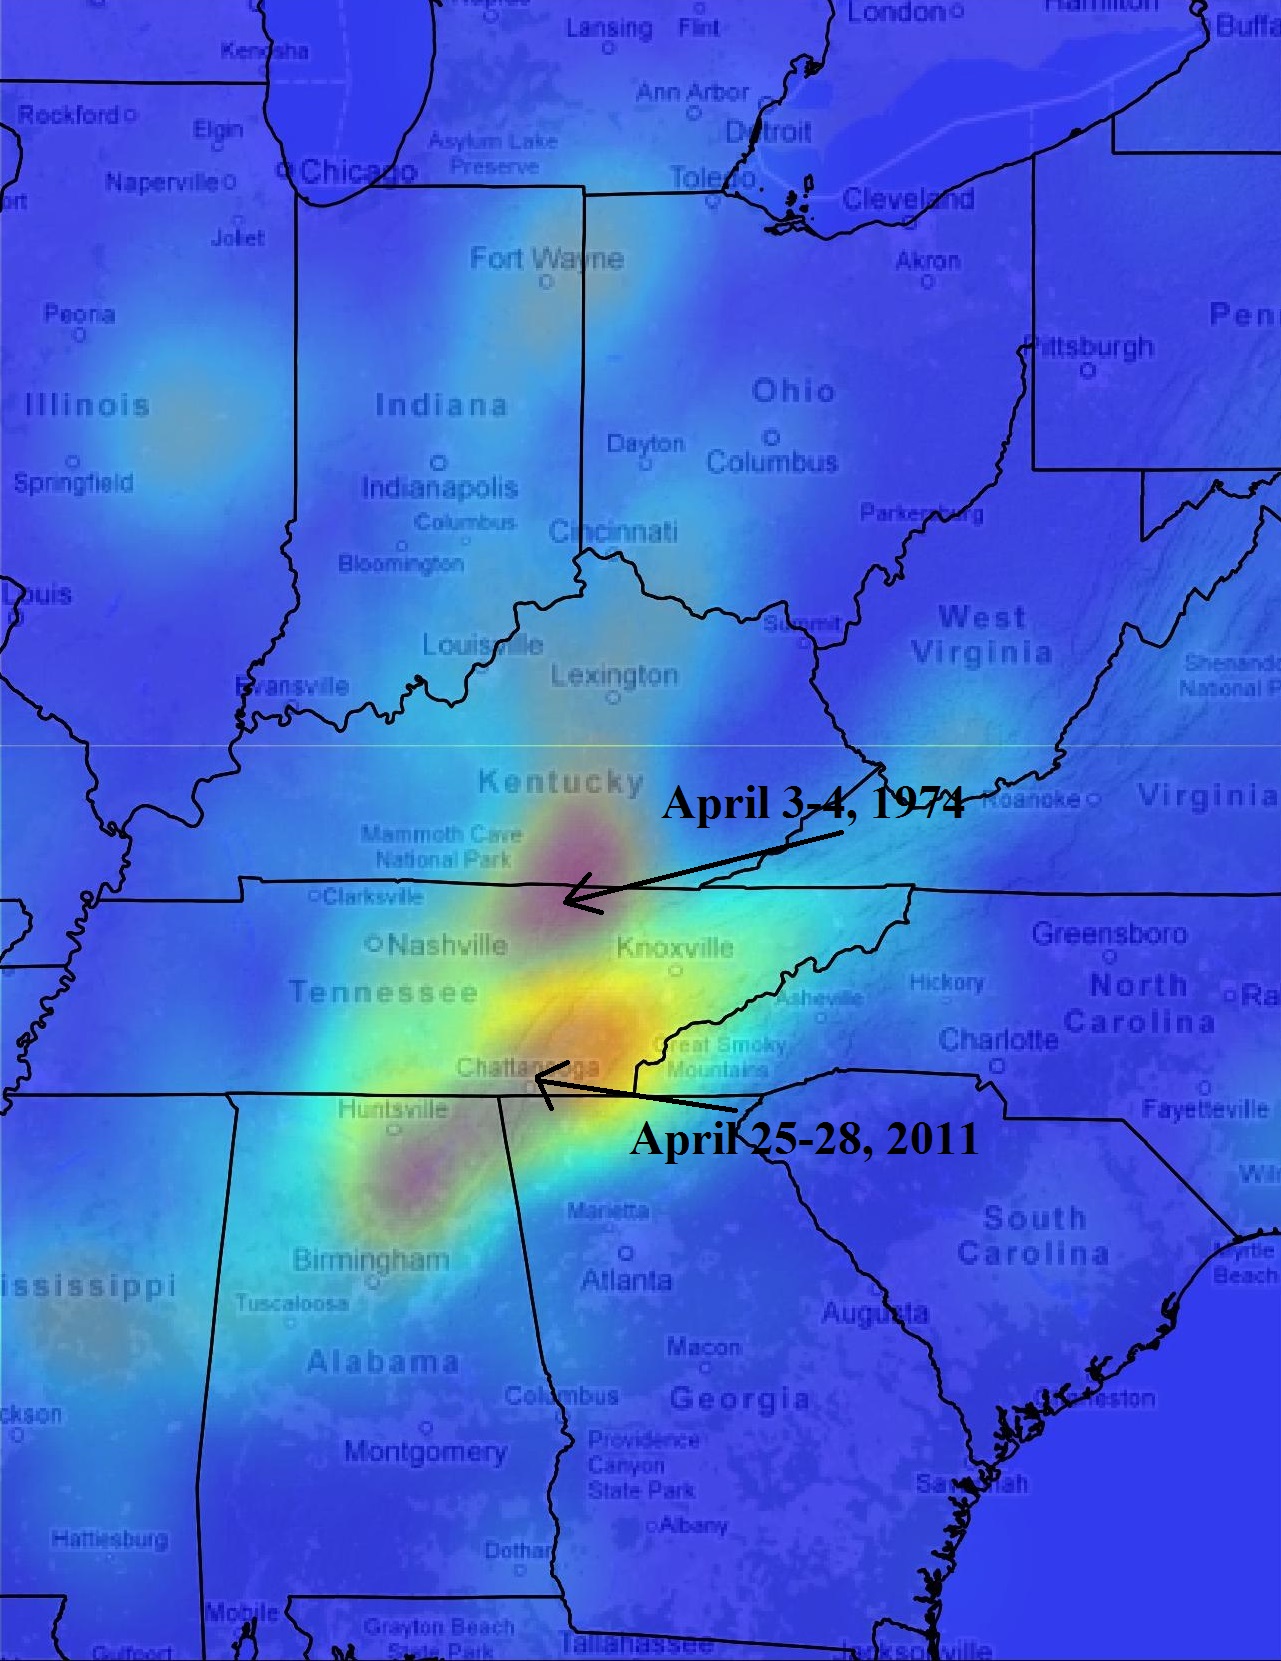
Analyzing the map it is easy to spot the different epicenters of the two events. It is also evident that Tennessee experienced a high density of tornadoes during both events.
Conclusion
When discussing the largest tornado outbreaks in United States history, the April 3-4, 1974 and April 25-28, 2011 are at the top of the list. These two events stick out in terms of sheer number of tornadoes that occurred, the intensity of the tornadoes that occurred, and the similarity that neither one occurred in “Tornado Alley.”
Both events are “must-study” case studies for all meteorologists including forecasters and students alike. In comparing and contrasting the two events, perhaps it is worth debating which event was in fact more impressive? The quick answer is 2011 simply due to the staggering number of 358 tornadoes. However, keep in mind that 1974 had almost double the amount of significant F/EF 3-F/EF5 tornadoes and over a much shorter time period.
Speaking of time period, some basic calculations reveal that while the 2011 outbreak had an average of 4.4 tornadoes per hour, the 1974 outbreak produced double that at 8.2 tornadoes per hour.
Which Super Outbreak do you think is more…. “Super?”
Latest posts by Kathryn Prociv (see all)
- Halloween tornadoes: The spooky historical facts - October 28, 2013
- From domestic to international: Tornadoes around the world - July 25, 2013
- U.S. tornadoes that occur outside the U.S. … the continental U.S. that is! - June 26, 2013
Very interesting! Thank for sharing this!
And your piece has me wondering if there are ways to compare the impact of these outbreaks in other relevant ways. Given the significant human toll in each event, I wonder if other statistics could be examined that would reflect the level of impact on the people who were there at ‘ground zero’ that go above and beyond basic casualty figures. ie. just how much suffering was shared by those who were there in during those terrifying hours?
Perhaps this fundamentally different point of view would be best served by making comparisons between the two outbreaks in terms of 1. ‘percentage of total distance travelled by tornadoes that occured in urban areas versus rural areas’ , b. ‘Death & Injuries per mile of tornado track.’, and c. Total number of tornadoes (or tornado miles?) where there was at least one serious injury.
Perhaps the first could give us a sense of how much suffering occured in locations where there would have been more people who would have directly witnessed the event and/or been exposed to the emotional ‘fallout’ in the panic-filled minutes immediately after the destruction had occured (sort of a ‘shared-suffering index’). The second could give us a sense of witnesses’ perceptions of the ‘casualty rate’ or ‘survival chances’ in each event, and the third would remove any tornadoes that would have not been responded to by emergency medical professionals or required protracted search & rescue efforts.
Even if my suggested calculations don’t seem all that useful, I still believe that finding a means to compare the amounts of shared physical & emotional suffering from the viewpoints of those who were part of the story ‘in the moment’ would shed a different light on how these two outbreaks compare.
Hi Derek,
Thanks so much for your thoughts! I agree in that looking at the non-meteorological factors could shed some real light on the severity and impact on the two events. There are some studies that have looked at the financial/damage loss aspects of the two events but I really like your idea of comparing rural vs. urban impacts.
Nice post, I love maps and the track maps are neat. Regardless of whether or not one was more “super”, the major tornadoes in eastern TN are amazing to me, there are two just west of the NC state line in 2011 on your map and I know that is very mountainous terrain with steep gorges. Were those EF3, 4, or 5? They look to be short-lived and probably were effected by the terrain, but still amazing they could even form and become EF3 or greater in that topography.
Based on your number, 1974 seems more “super” to me. EF0 or even EF1, while surely ABLE to cause destruction and loss of life, generally to me seem like more nussiance events that cause minor damage to homes and businesses. The winds of an EF0 are like that of a severe thunderstorm but only in a small very narrow location whereas a severe thunderstorm affects a wide area. So an outbreak of EF0s seem like nothing more noteworthy than a few severe thunderstorms. Significant to the few affected, but not really earth-shattering news stories. The large numbers of EF3s and above in 1974 seem to me to make it a huge story. (Of course that’s not to minimize the large tornadoes in 2011 and loss of life and property for all those affected, it was still a big story as I remember the news very clearly from that.)
Jim all great points. I agree with you in that the 1974 outbreak seemed more intense with the higher number of strong and violent tornadoes. When you mentioned the few tornadoes that seemed to cross over mountainous and rugged terrain, I actually studied the effect of topography on supercell thunderstorms for my M.S. and found some interesting trends.
While mountains have an overall mitigating influence on storms due to higher stability, on the tiny scale that tornadoes exist at the topography can actually enhance wind flow that could cause rapid (albeit weak) spin-ups into brief tornadoes!
These “Super Outbreak” Events are fascinating to me. Perhaps an obvious question needs to be studied. If a meteorologist were to put the parameters of these two atmospheric conditions onto a board and compare the conditions present for the 1974 event and compare it to the 2011 event. Add to that the 1965 Palm Sunday outbreak and other particularly awful tragedies such as the Joplin, MO. Tornado and the mega tornadoes that have hit the Central part of Oklahoma recently a forecaster could then not only have a blueprint for the makings of a “dangerous day” but could study and examine which of several attributes seemingly were more correlated to these events. These “truths” alone if explained and illustrated to the general public might tend to better mobilize those in proximate danger. These types of warnings are generated prior to the landfall of a hurricane and people who are in areas that are certain to flood get lead time to move to higher ground. Why shouldn’t the general public be as well informed prior to dangerous tornado outbreaks? The questions sound rhetorical but they obviously aren’t. Why did so many people die in the Joplin, MO. Tornado. Anyone who can answer this question to any useable satisfaction to relatives of the victims are on the right track.
Thanks for your work on the topic.
Best,
Bill
2 or 3 of the F5s wouldn’t have cut the mustard of being an EF5 by today’s standards. IF the lax rules of 1974 were applied to 2011, The Tuscaloosa tornado would have been an EF5 with ease and should have been any way. That goes for Ringold Georgia, Shoal Creek Alabama and Flat Rock Alabama.
Jim I just realized you’re Jim as in Jimmytrain21! You’re already familiar with my research… Sorry about the repeat!!
Great article that really put these 2 “super” outbreaks in context. Its really hard to discern which was more super because I have seen studies that say some of the tornadoes of the 74 outbreak would be rated lower going by the EF scale we use today. Either way my county in Kentucky was hit by 3 of these tornadoes. I was not alive but I know all about it as my parents lived through it, Pulaski County in Kentucky. These two events were amazing and catastrophic at the same time. Anyways I just wanted to tell you that I loved the article and keep up the great work.
Hi Michael! Thanks so much for checking out the site, and I’m glad to hear you enjoy the articles!
It is definitely amazing how many tornadoes both Kentucky and Tennessee received during the 1974 outbreak, especially since they represent two states NOT in “tornado alley!”
Un fortunately, Alabama had the most deaths in both cases. I was 15 in ’74 and remember it well. 78 dead Alabamians in 1974 and 253 in 20 11. That shows how much more powerful the 2011 tornadoes were. Despite all the groundbreaking advances in tornado science, almost 350 people were killed in the2011 outbreak.
Hi there! This is my first comment here so I just wanted
to give a quick shout out and tell you I truly enjoy reading through your articles.
Can you suggest any other blogs/websites/forums that go over the
same subjects? Thanks for your time!
Thank you for reading! Glad you enjoy our articles. Another great site is the Washington Post’s Capital Weather Gang page. While most articles are catered to Washington, D.C. area weather, there are also great write-ups on other weather topics!
http://www.washingtonpost.com/blogs/capital-weather-gang/
In my opinion, there were likely MANY MORE weaker tornadoes (EF-0 and EF-1) than were reported during the ’74 Super Outbreak. You see, the way we detect and measure tornadoes has changed drastically over the last 3 or 4 decades. Now, because of advanced radar systems, increased number of spotters, chasers and a larger general population just about EVERY tornado is detected if not videoed. That was not the case in 1974. A truer measuring stick between these two outbreaks would be the comparison of strictly strong tornadoes (EF-3-EF-5), like the one above, because these were not likely to be missed. Also, another point to note, is that an “outbreak” is considered to be a continuous event. The April 25 – 28th event was not. It is considered a tornado “sequence”. Which is a series of tornado outbreaks, not a singular event. So that too artificially inflates the numbers of the 2011 storm.