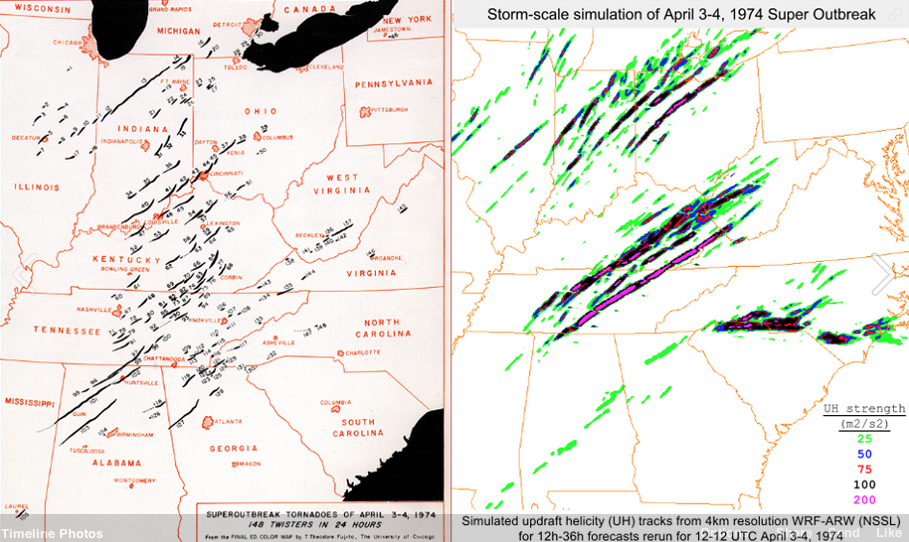
During a period of just 18 hours between April 3rd and 4th, 1974, the so-called Super Outbreak dropped 147 tornadoes across 13 states. This was the largest and most violent tornado outbreak of the 20th century, and likely only matched in scale by the outbreak of 2011. In all, there were 30 F4 and F5 tornadoes recorded during this period, and over half of the tornadoes recorded were classified as F2 or higher.
Related: Looking back and recreating the maps | A Numerical Comparison of 1974 and 2011
Forty years later this outbreak continues to be an important case study for severe weather. Just this week the Storm Prediction Center released a simulation of what today’s storm-scale models may have forecast for this event. While warning lead-times have more than doubled since the 1970s, forecasting where and when tornadoes will form remains a critical challenge still today.
Tragically, the 1974 outbreak caused 315 fatalities and over 6,000 storm related injuries. Damage estimates from the outbreak are estimated at over 600 million dollars.
Below is an interactive map of the outbreak (view full version here). Mousing over the individual tornadoes will give statistics on that tornado as collected by the Tornado History Project. Mousing over the legend in the lower right hand corner will isolate the tornadoes by Fujita classification.
Latest posts by Brendan Heberton (see all)
- A tornado’s cost: Living in a tornado alley - April 24, 2014
- The 1974 Super Tornado Outbreak (interactive map) - April 3, 2014

One thought on “The 1974 Super Tornado Outbreak (interactive map)”