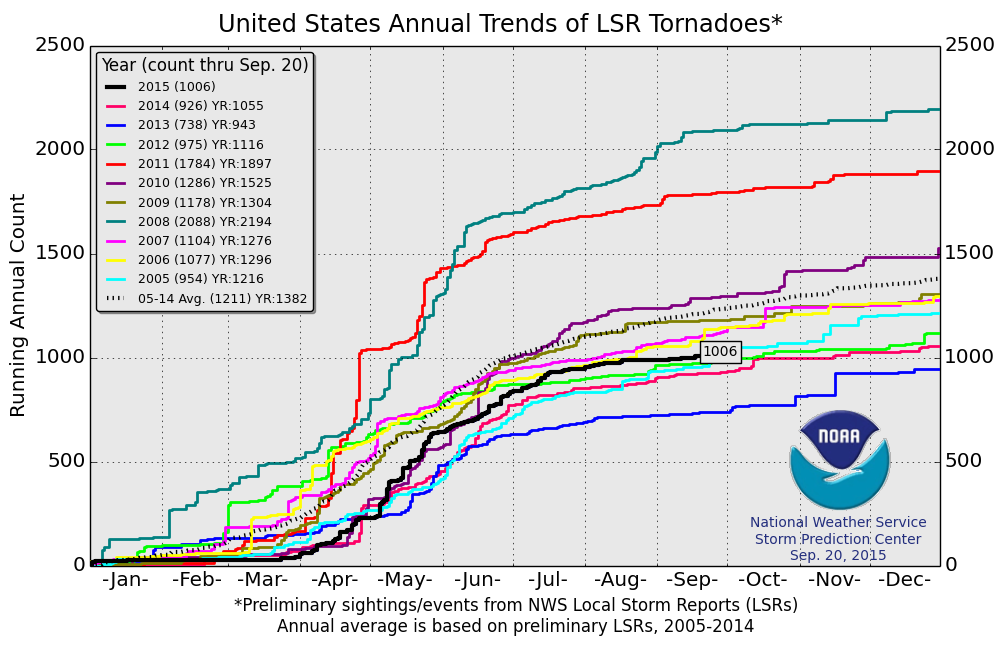
The 2015 tornado year might best be described as confused. It hasn’t been a full-time dud. The most active period brought a lot of tornadoes, and it came about when it should have.
However, like recent years, the oddities tend to outweigh normalcy. This year, one prominent story is the lack of big-time tornadoes. The one and only EF4+, those rated violent on the tornado scale, occurred way back in April.
Such tallies threaten a tie for the least number of violent tornadoes on record. And if you add in the much more numerous but still quite intense EF3 tornadoes, we find the story of 2015’s powerful tornado drought is an even deeper one.
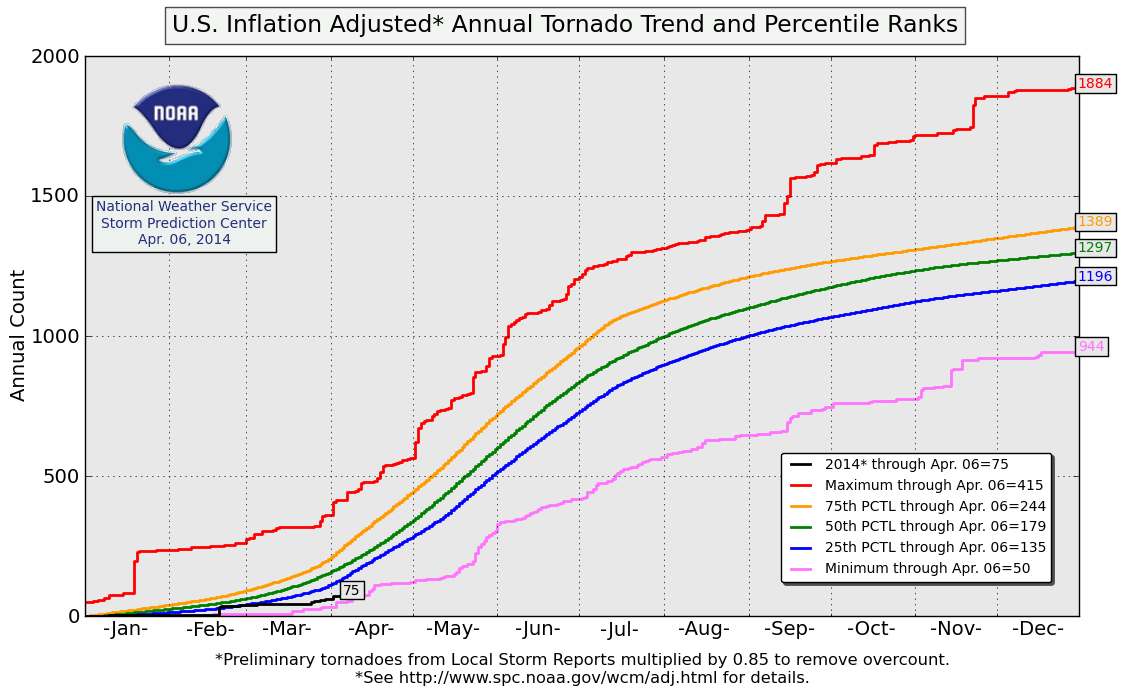
As the year got going it seemed it was ready to continue the quiet streak we’ve seen since 2012 in particular.
Then historic rains hit the southern Plains. If it’s raining a lot in spring, and it seemed to never stop in May, there’s bound to be tornadoes. By and large the heart of the spring season ended up fairly normal when it comes to numbers, even though it lacked massively destructive outbreaks.
The summer tornado season is rarely terribly impressive, but this one was not memorable in the least. Tornado numbers relative to average again grew further apart after coming together in April-June.
Throughout the ups and downs, there has been one great lacking: intense to violent tornadoes. As of publication, only 12 verified EF3 tornadoes have touched down and only one verified EF4 has occurred. This is as low as it gets.
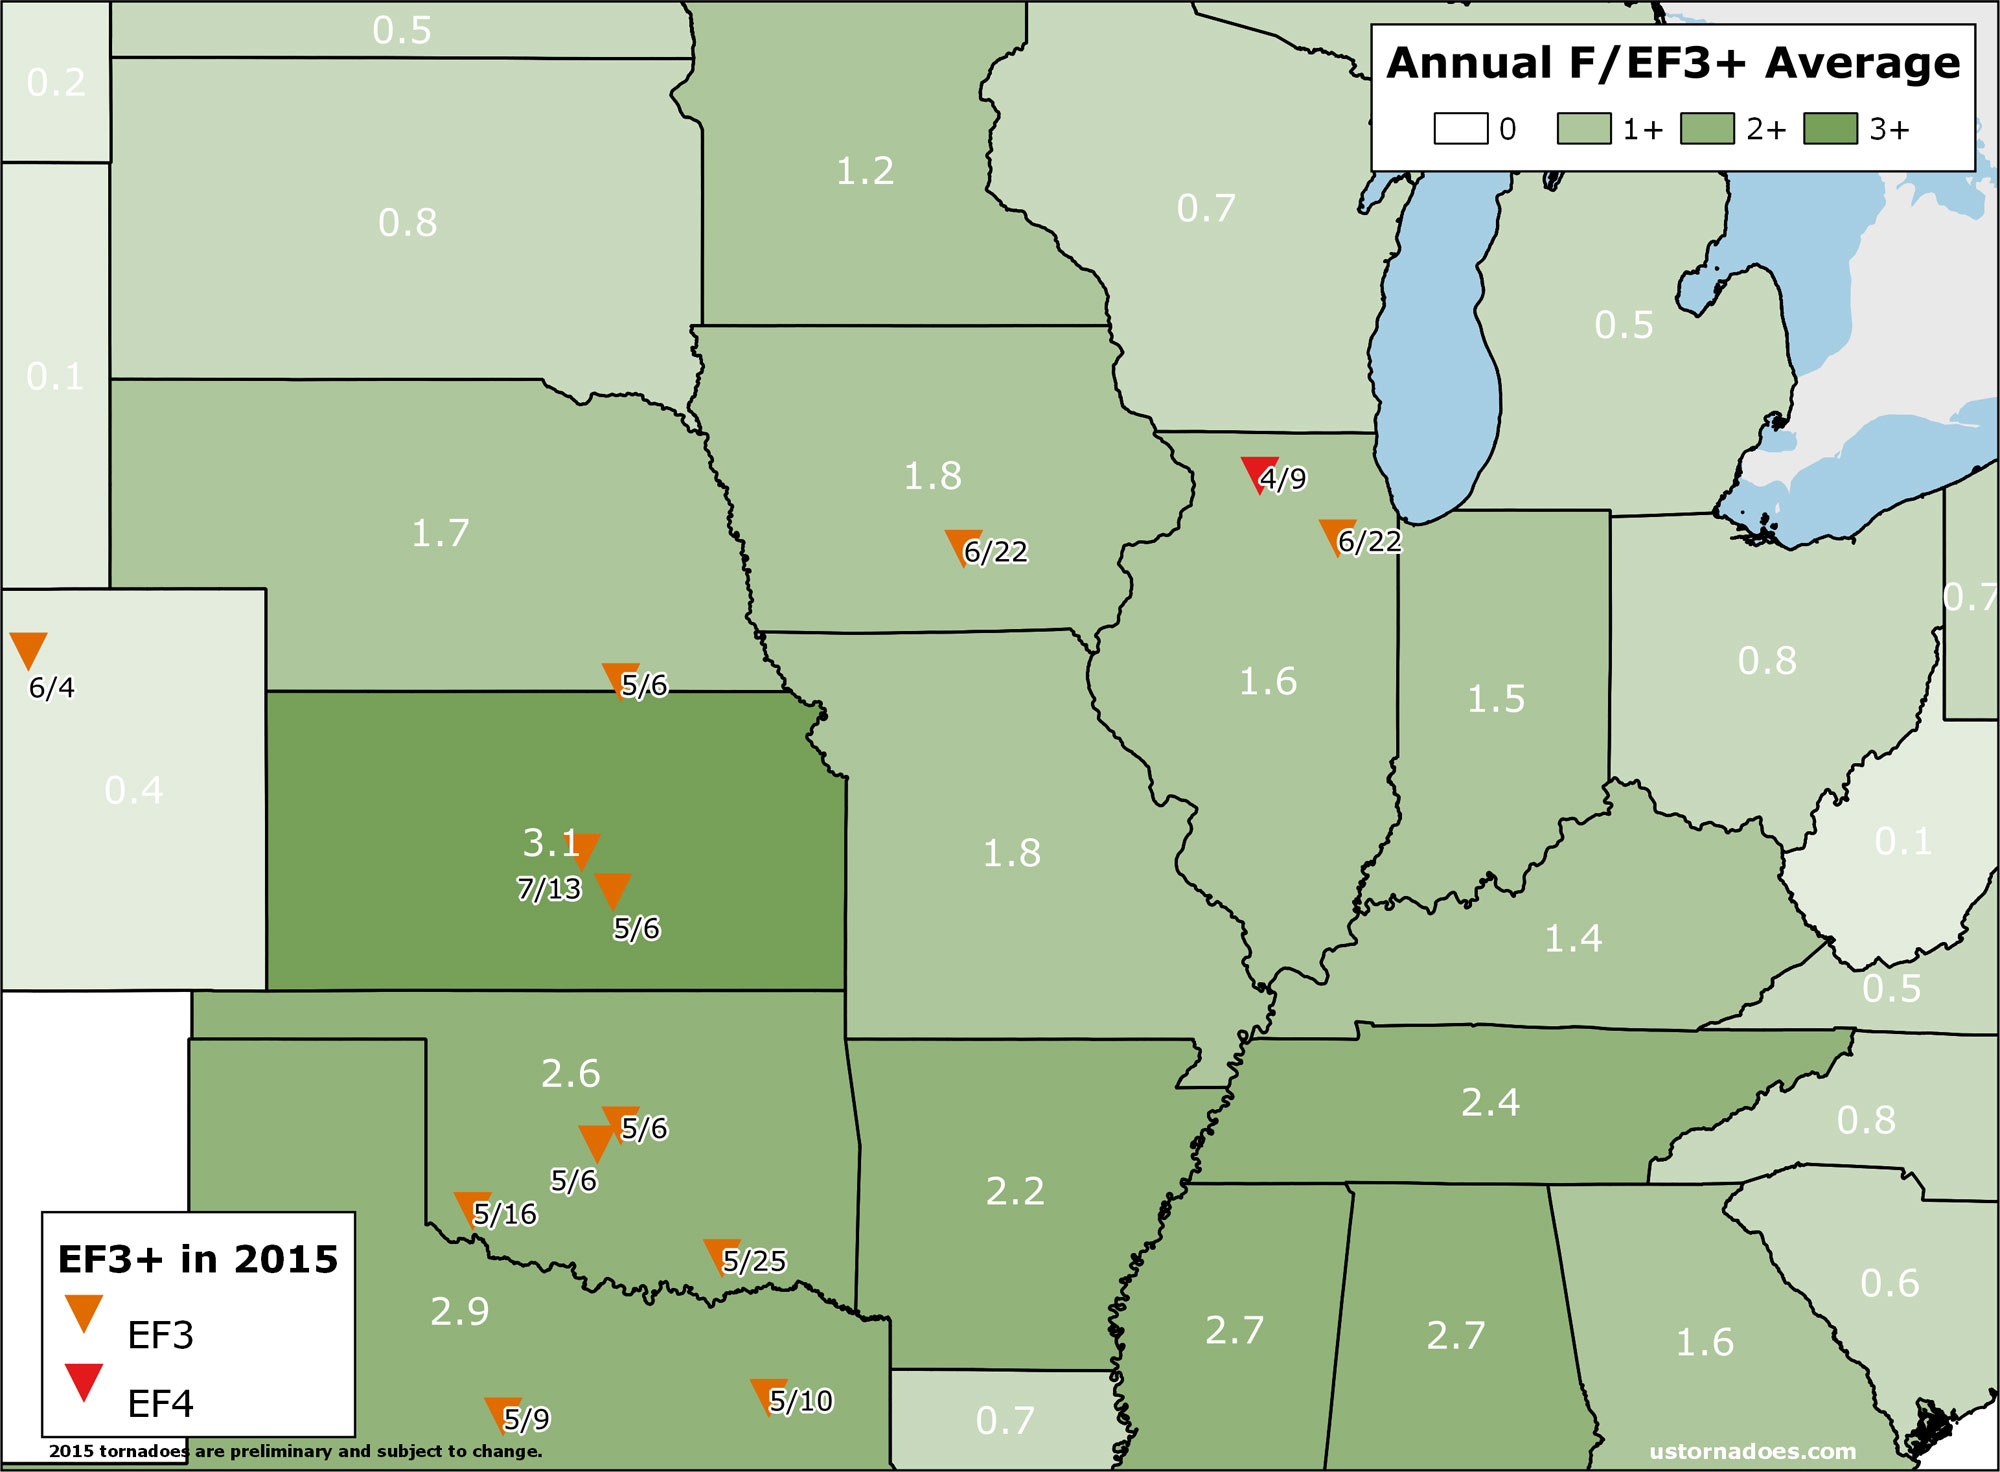
EF3+ tornadoes
Using the last 30 years ending 2014 as a guide, the average for F/EF3+ tornadoes is 36 per year. As shown on the map above, the places most likely to see several EF3+ tornadoes per year are dominated by the southern to central Plains, the Midwest, and the South.
One thing that may stand out in the trend line is that the number of F/EF3 or greater tornadoes has declined across the modern historical record. It is likely that some of this is due to different ratings standards in the past compared to today, and perhaps better building standards as well.
In the last three decades, there has been considerable year-to-year fluctuation but the long-term average has remained rather steady.
The 13 EF3+ tornadoes through August ranked as the 4th lowest total in history thru the end of that month. If somehow it is able to hold at that number, it will surpass the record low for a full year of 15 in 1987. In full disclosure, through the end of August, 1987 had seen only 10 F3+ tornadoes, the lowest on record. It added another five of them before the year was out. That was an El Nino year, as is this one.
Given the quiet start and somewhat typical peak season, it can be seen in the map above that EF3+ events mostly skipped the early-season grounds of the South and Southeast. Parts of the southern Plains and the Midwest have still seen near or even above normal numbers thus far.
Violent tornadoes
Let’s step up to the real beasts, those rated F/EF4 and F/EF5.
Over the past 30 years ending 2014, the United States has averaged 7.5 violent tornadoes per year. Removing 2011 and replacing with 1984, that average is 7.2. So while 2011 was a big year for tornadoes, it didn’t necessarily destroy the average of late.
The long-term trend is a downward one here as well. But in a similar way to the F/EF3+ rankings, some of this is attributable to more stringent ratings procedures today.
The one violent tornado to date puts the United States about on par with four other years since 1950 that had either zero or one. 2005 is the only year that had zero F/EF4+s through this point. It later snagged its only violent tornado of the year on November 15th, during an outbreak across the Midwest.
Although there are only four prior years since 1950 with this few or fewer violent tornadoes prior to September, 2015 made it four out of the top five happening since 2000. And in the top eight in that category, all with two or fewer violent tornadoes, six are since 2000.
The historical odds going forward
Once again using the last 30 years as a guide, we might “expect” to finish the post-August year with another five to six EF3+ tornadoes given an average of 5.5 during this time period.
As recent as 2013 there were a dozen more, mainly during the major tornado outbreak of November 17.
Looking at moderate-to-strong El Nino falls, there’s the suggestion of about the same when it comes to additional EF3+ tornadoes to come. The average there is five more after August. The 2002 El Nino fall finished with 12 from September through December.
Getting past one violent tornado may be trickier. The odds are not necessarily strongly for or against.
The average from here out is one additional, but about half of the years don’t see another at this point in the season. The “second season” is certainly a thing, but it’s not quite as dependable as the main tornado period in the spring. The numbers of events and tornadoes are considerably lower by comparison.
The very low death toll from tornadoes this year — now at 10 — is undoubtedly related to the lack of those being strongly rated. While many droughts are cause for concern, this is one we can all embrace.
November 20 update
The November 16 tornado outbreak produced three EF3 tornadoes, bringing this year’s total EF3+ to 16. This moves it one ahead of the low in 1987. EF4+ tornadoes are still running tied for the lowest on record.
The list
April 9
Illinois: http://www.weather.gov/lot/15apr09
May 6
N Kansas: https://www.ncdc.noaa.gov/stormevents/eventdetails.jsp?id=565935
S Central Kansas: http://www.weather.gov/ict/6MaySevereWx
C Oklahoma (2): http://www.srh.noaa.gov/oun/?n=events-20150506
May 9
NC Texas: https://twitter.com/NWSFortWorth/status/597458399001845760
May 10
NE Texas: https://twitter.com/NWSFortWorth/status/597855084354084864
May 16
SW Oklahoma: http://www.srh.noaa.gov/oun/?n=events-20150516
May 25
S Oklahoma: http://www.srh.noaa.gov/oun/?n=tornadodata-ok-2015
June 4
NE Colorado: http://www.weather.gov/bou/StormSurveys
June 22
Iowa: http://www.weather.gov/dmx/iators2015
Illinois: http://www.weather.gov/lot/22June2015
July 13
Kansas: http://www.weather.gov/ict/071315
November 16
Kansas: http://www.weather.gov/ddc/TornadoOutbreak2015Nov16
Texas (2): https://twitter.com/NWSAmarillo/status/667796067249819650
Note: All tornado counts for this year are preliminary and subject to change, or even being missed in the map/count above. There is no central repository for this information even though there should be, so data for 2015 has been cobbled together from numerous sources! Storm data is sometimes finalized before a year is over, but the official full-season package doesn’t come out until early 2016. One example above is the May 16 tornado, which was initially rated an EF2.
Latest posts by Ian Livingston (see all)
- Tornado outbreaks: April, May and June peak-season primer - April 27, 2025
- Busy March for twisters to end with another multi-day event - March 28, 2025
- Everything but locusts: NWS shines in apocalyptic weather - March 17, 2025