by Quincy Vagell and Ian Livingston
Posted: April 19, 2016. Last updated: August 1, 2016.
When it comes to tornado tracking year-to-year, a big item that has been missing is a near real-time U.S. tornado database.
A likely reason for the lack of such information is that there are many places to compile it from. It’s a daunting task to gather perhaps 1,200 tornadoes from potentially 100 or more sources. Nothing other than the Wikipedia compilation is public as a running tornado list, and Storm Data has at least a several month lag. The official tornado tabulation doesn’t currently show up until spring of the season following.
We attempted to disrupt that flow. We learned first hand of many of the difficulties of attempting a project like this. While we felt we offered up as accurate a look at the counts across the country as possible, we felt the product was always going to lack something we were looking for.
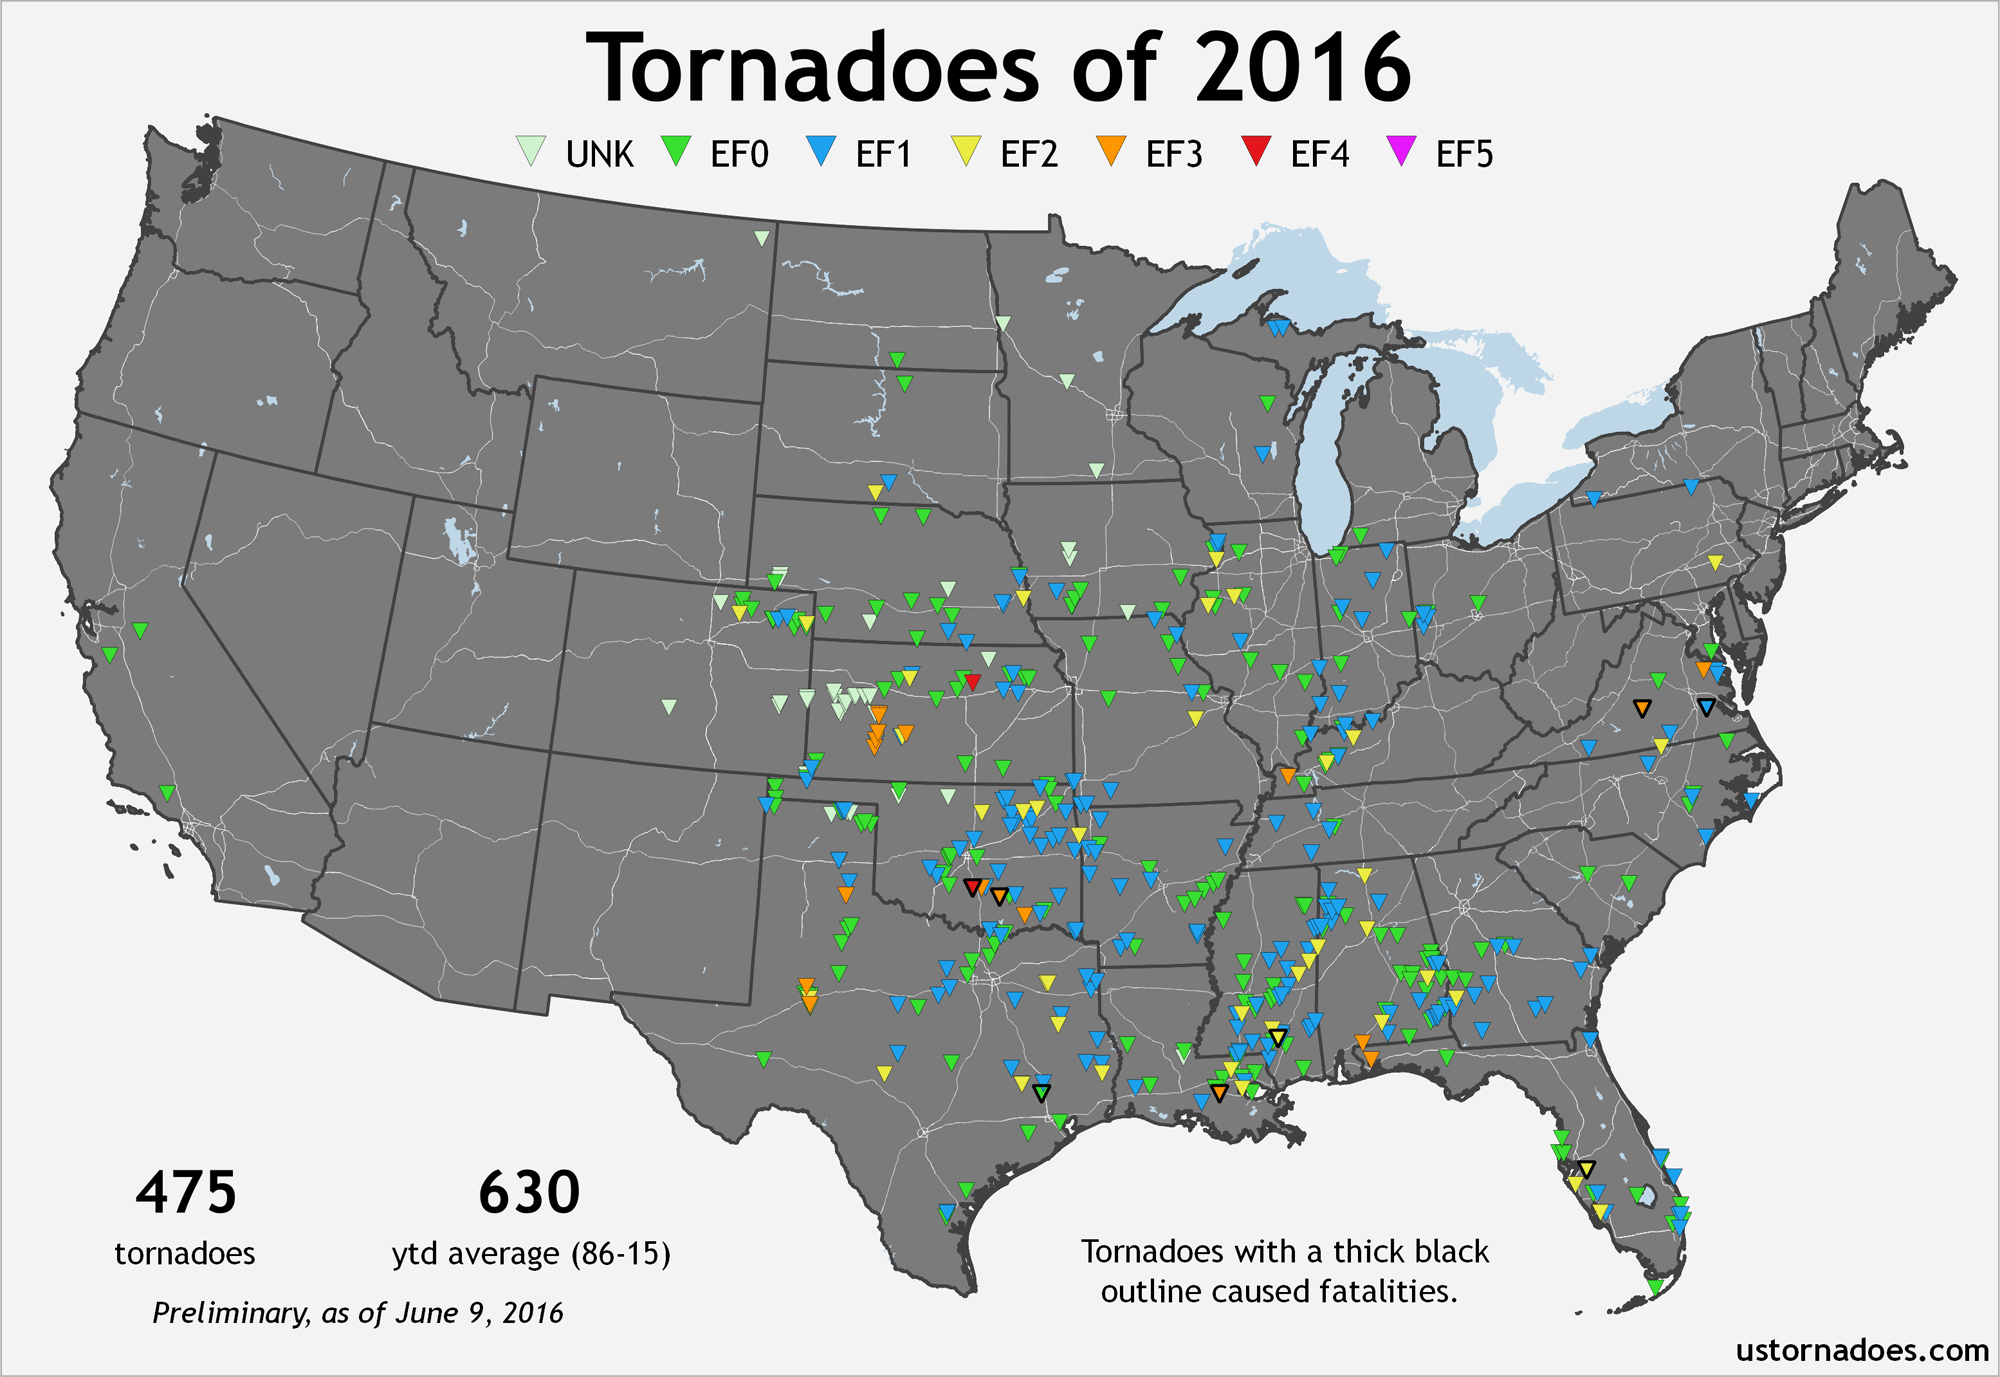
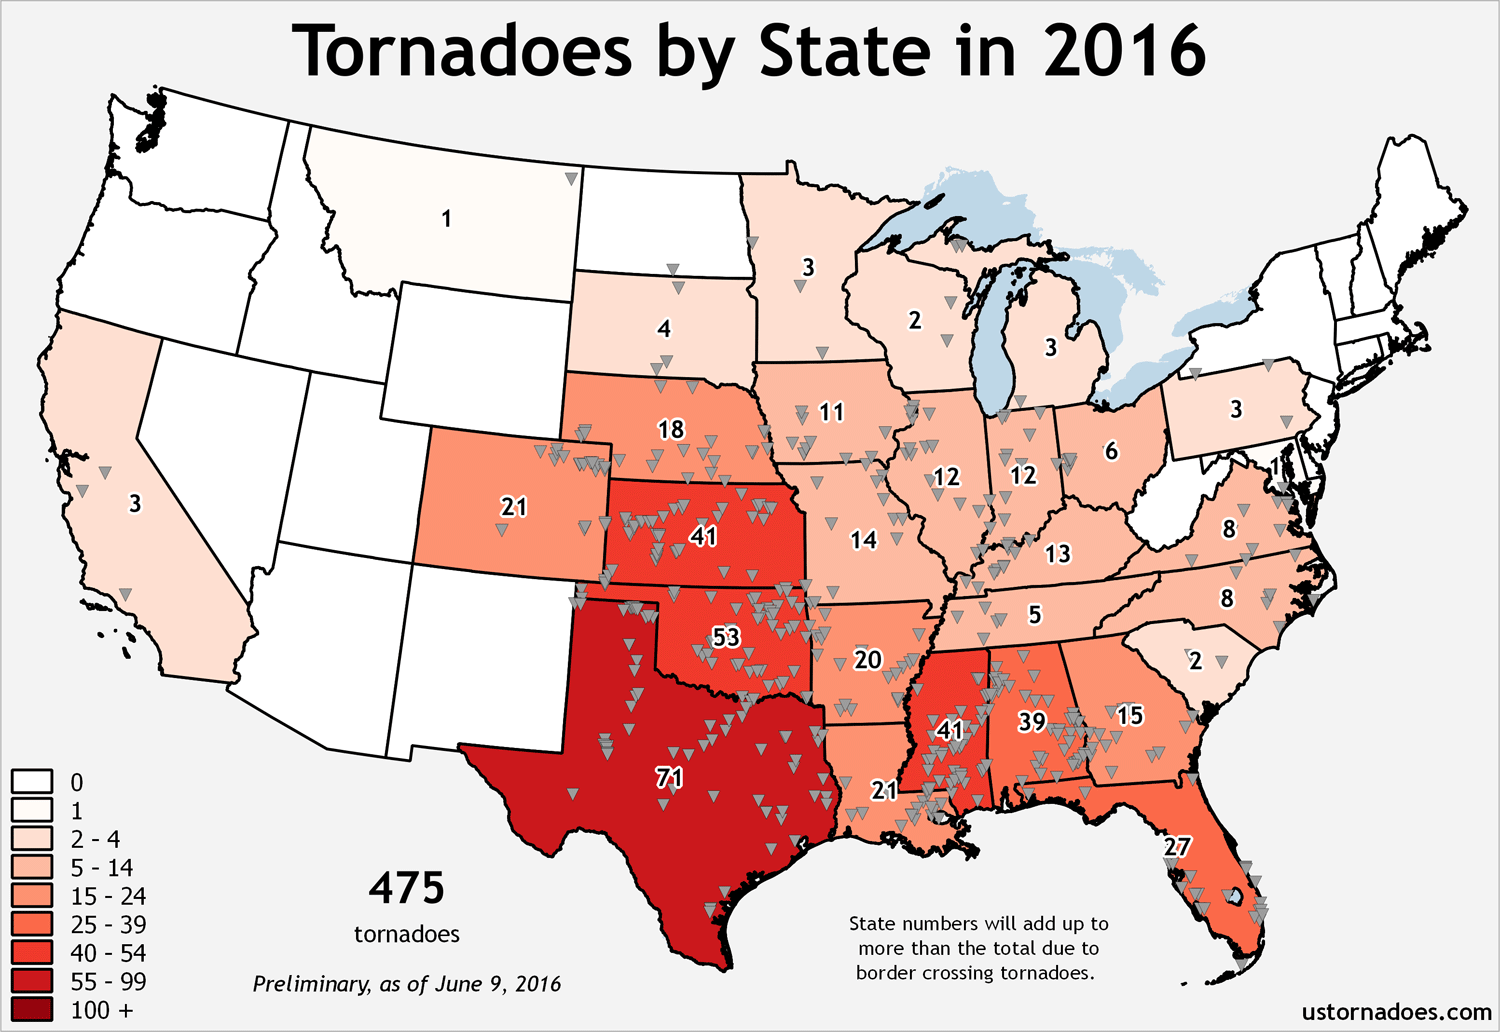
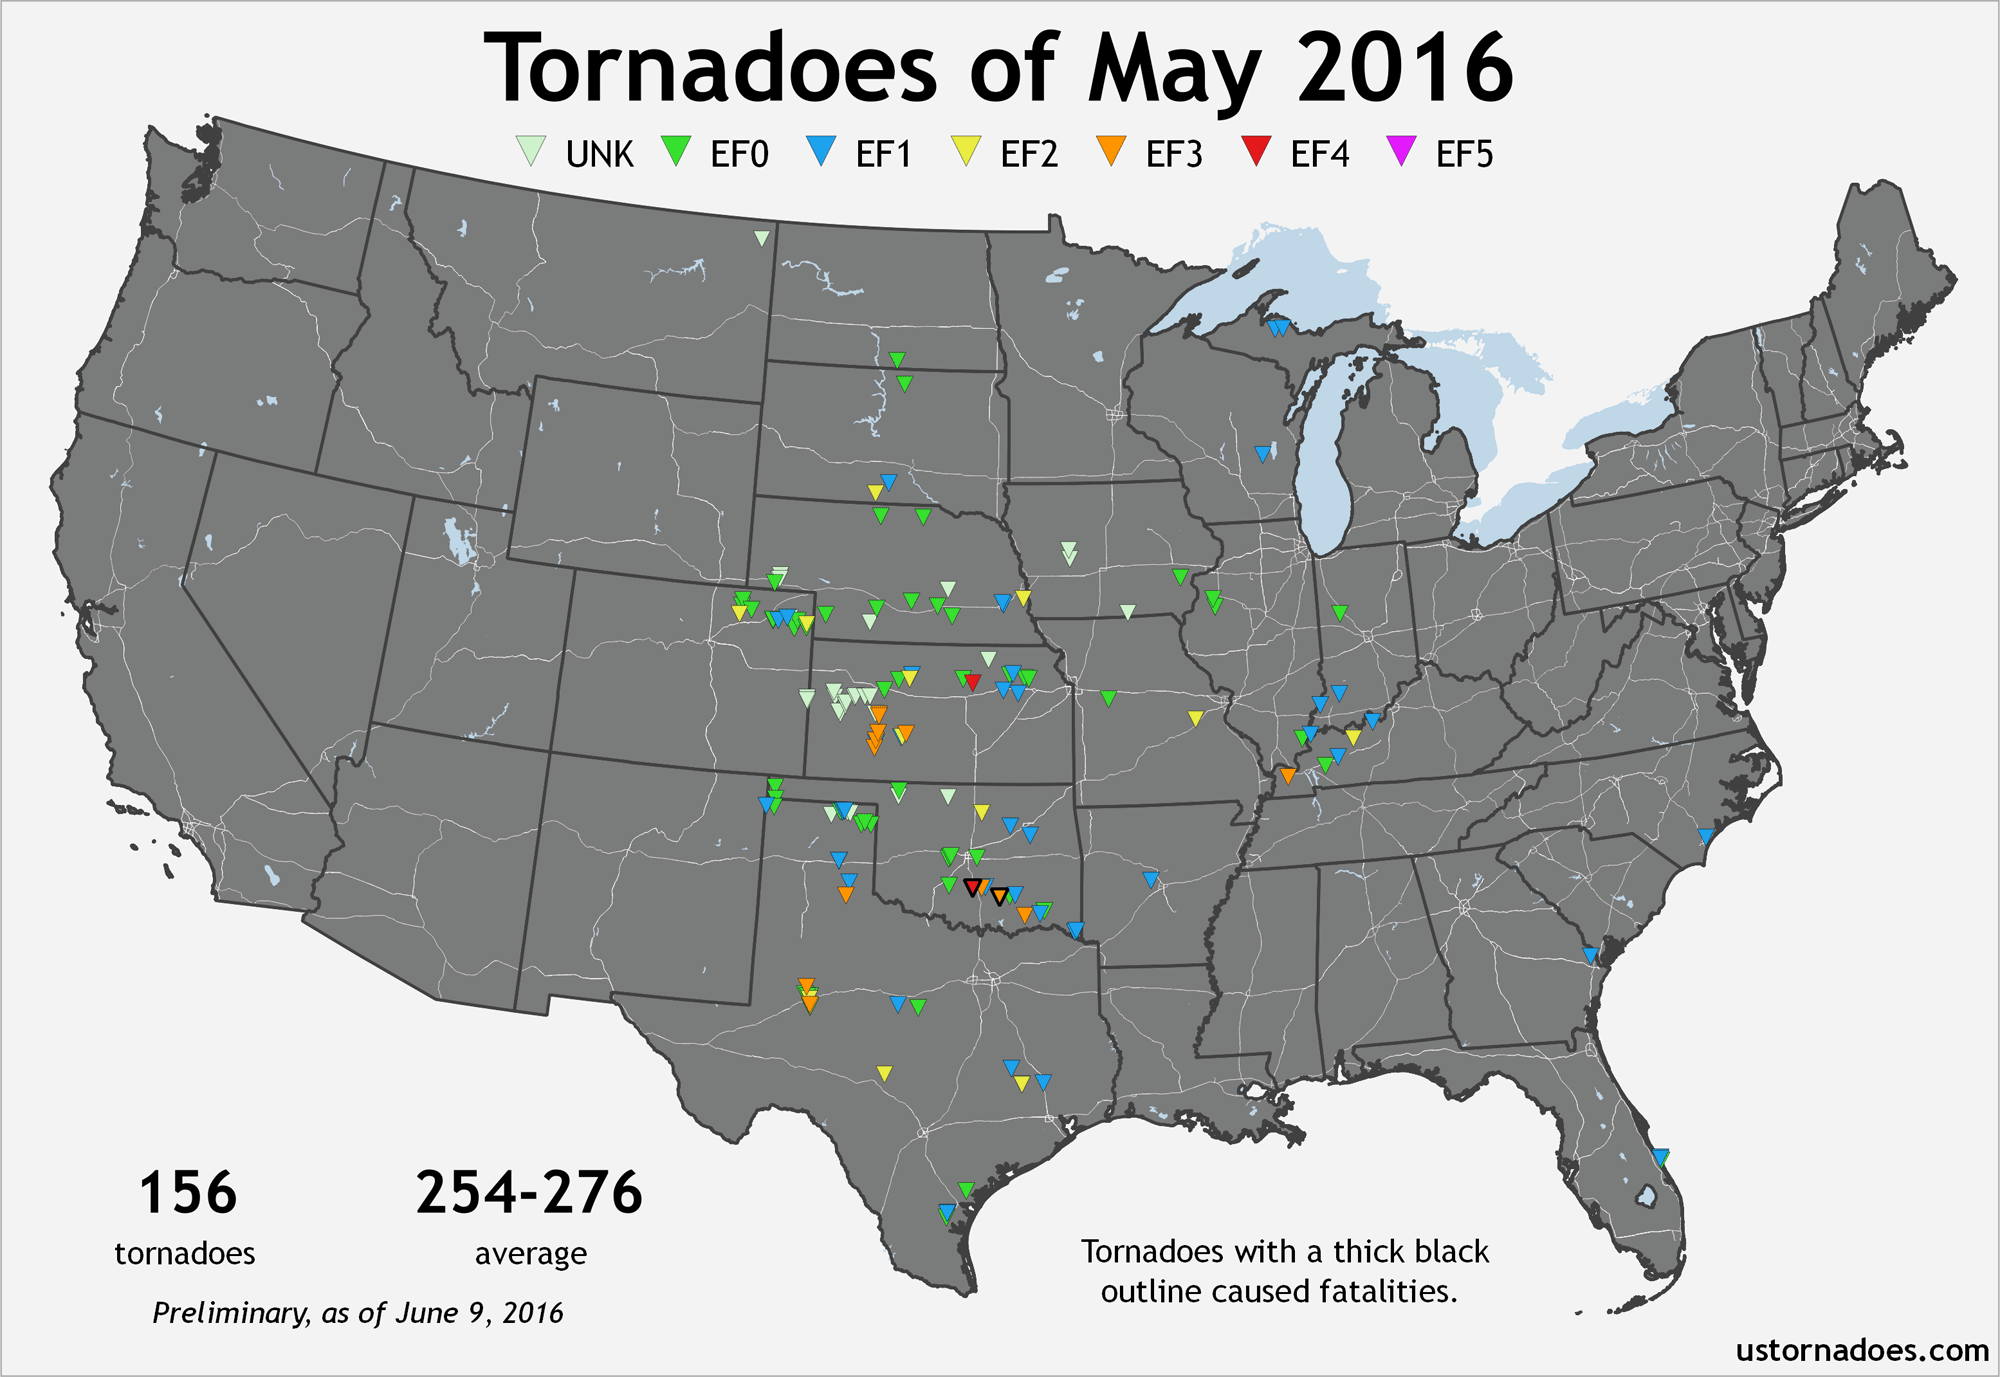
All the tornadoes of 2016 thru early June
Track length is measured in miles. Max width is measured in yards. Table data and top map as of June 9, 2016 with known tornadoes through the day prior.
| OUTBREAK | DATE | OFFICE | STATE | LOC | RATING | LENGTH | WIDTH | FATAL | INJ | ||||||
|---|---|---|---|---|---|---|---|---|---|---|---|---|---|---|---|
| A | 1/2 | JAN | MS | 7 ENE McNair | EF0 | 4 | 250 | 0 | 0 | ||||||
| A | 1/2 | JAN | MS | 1 WSW Peyton | EF1 | 5.62 | 200 | 0 | 0 | ||||||
| A | 1/2 | JAN | MS | 3 ENE Caseyville | EF1 | 6.8 | 300 | 0 | 0 | ||||||
| A | 1/2 | JAN | MS | 1 WNW Pinola | EF1 | 9.5 | 400 | 0 | 0 | ||||||
| A | 1/2 | JAN | MS | 2 S Mount Olive | EF2 | 4.2 | 300 | 0 | 0 | ||||||
| A | 1/2 | JAN | MS | 4 W Stringer | EF1 | 3.9 | 275 | 0 | 0 | ||||||
| A | 1/2 | JAN | MS | 3 WSW Purvis | EF1 | 8.4 | 225 | 0 | 0 | ||||||
| A | 1/2 | JAN | MS | 6 N Enterprise | EF0 | 1.5 | 75 | 0 | 0 | ||||||
| A | 1/2 | BMX | AL | 2 WNW Beans Crossroads | EF1 | 3.4 | 485 | 0 | 0 | ||||||
| A | 1/2 | TAE | AL | 2 SSE Malvern | EF2 | 7.59 | 500 | 0 | 0 | ||||||
| A | 1/2 | TAE | AL | 2 N Baconton | EF1 | 3.99 | 200 | 0 | 0 | ||||||
| A | 1/2 | TAE | AL | 1 WNW Ardilla | EF1 | 2.58 | 200 | 0 | 0 | ||||||
| A | 1/2 | TAE | GA | 5 E Stocks | EF1 | 9.16 | 600 | 0 | 0 | ||||||
| A | 1/2 | TAE | GA | 1 E Sawhatchee | EF2 | 4.45 | 400 | 0 | 0 | ||||||
| A | 1/2 | TAE | GA | 1 SSW Centerville | EF2 | 11.1 | 1000 | 0 | 0 | ||||||
| A | 1/2 | TAE | GA | 1 SSW Rowena | EF2 | 4.57 | 500 | 0 | 0 | ||||||
| A | 1/2 | TAE | GA | 1 N Riverturn | EF1 | 3.74 | 600 | 0 | 0 | ||||||
| A | 1/2 | TAE | GA | 2 SSW Cooktown | EF1 | 9.97 | 1000 | 0 | 0 | ||||||
| A | 1/2 | LIX | LA | E Kentwood | EF1 | 0.5 | 75 | 0 | 0 | ||||||
| A | 1/2 | LIX | MS | E Magnolia | EF1 | 4 | 100 | 0 | 0 | ||||||
| A | 1/2 | LIX | MS | W Tylertown | EF1 | 1 | 100 | 0 | 0 | ||||||
| A | 1/2 | LIX | LA | Bush | EF0 | 0.0170455 | 5 | 0 | 0 | ||||||
| A | 1/2 | LCH | LA | 4 NE Fields | EF1 | 0.3 | 20 | 0 | 0 | ||||||
| A | 1/2 | LCH | LA | 4 SSW Ragley | EF1 | 2.8 | 100 | 0 | 0 | ||||||
| A | 1/2 | LCH | LA | 3 WSW Mamou | EF0 | 0.5 | 25 | 0 | 0 | ||||||
| A | 1/2 | LCH | LA | 2 SSE Meeker | EF1 | 1.4 | 100 | 0 | 0 | ||||||
| A | 1/2 | LCH | LA | Bunkie | EF1 | 1.6 | 200 | 0 | 0 | ||||||
| A | 1/2 | LCH | LA | Hessmer | EF1 | 2.4 | 200 | 0 | 0 | ||||||
| A | 1/2 | LCH | LA | 2 S Marksville | EF1 | 1 | 200 | 0 | 0 | ||||||
| A | 1/2 | LCH | TX | 10 NNW Jasper | EF1 | 2.6 | 100 | 0 | 0 | ||||||
| A | 1/2 | LCH | TX | 4 SE Trout Creek | EF1 | 2.6 | 100 | 0 | 0 | ||||||
| A | 1/2 | LCH | LA | 2 N Oretta | EF1 | 1.2 | 50 | 0 | 0 | ||||||
| A | 1/2 | LCH | LA | 6 SW Longville | EF1 | 4.6 | 100 | 0 | 0 | ||||||
| A | 1/2 | LCH | LA | 5 ESE Boyce | EF1 | 0.5 | 50 | 0 | 0 | ||||||
| A | 1/2 | FFC | GA | 10 miles SE Lumpkin | EF1 | 0.6 | 200 | 0 | 0 | ||||||
| B | 1/21 | JAN | MS | 5 WNW Purvis | EF3 | 24.2 | 900 | 4 | 56 | ||||||
| B | 1/21 | BMX | AL | 3 WSW Putnam | EF1 | 5.5 | 800 | 0 | 0 | ||||||
| B | 1/21 | BMX | AL | 1 ESE Wayne | EF1 | 4.2 | 900 | 0 | 0 | ||||||
| B | 1/21 | BMX | AL | 1 SW Wetumpka | EF1 | 1.54 | 450 | 0 | 0 | ||||||
| B | 1/21 | BMX | AL | 2 SSE Blue Ridge | EF1 | 0.68 | 200 | 0 | 0 | ||||||
| B | 1/21 | BMX | AL | 2 S Emerald Mountain | EF0 | 0.21 | 90 | 0 | 0 | ||||||
| B | 1/21 | BMX | AL | 3 N Society Hill | EF1 | 2.84 | 800 | 0 | 0 | ||||||
| B | 1/21 | FFC | GA | 4.2 SSW LaGrange | EF1 | 5.6 | 200 | 0 | 0 | ||||||
| B | 1/21 | BMX | AL | 5 S Auburn | EF0 | 2.38 | 150 | 0 | 0 | ||||||
| B | 1/21 | BMX | AL | 5 N Goshen | EF1 | 37.47 | 400 | 0 | 0 | ||||||
| B | 1/21 | BMX | AL | 2 NNE Beauregard | EF0 | 1.07 | 150 | 0 | 0 | ||||||
| B | 1/21 | BMX | AL | 3 SSE Opelika | EF0 | 0.82 | 150 | 0 | 0 | ||||||
| B | 1/21 | BMX | AL | 2 NW Crawford | EF0 | 0.5 | 50 | 0 | 0 | ||||||
| B | 1/21 | BMX | AL | 1.25 WSW Smiths Station | EF1 | 0.76 | 200 | 0 | 0 | ||||||
| B | 1/21 | FFC | GA | 1 NW Fortson | EF1 | 10.95 | 400 | 0 | 0 | ||||||
| B | 1/21 | FFC | GA | 4.75 WSW Woodland | EF0 | 1.9 | 100 | 0 | 0 | ||||||
| B | 1/21 | FFC | GA | 2.3 NE Woodland | EF1 | 9.1 | 300 | 0 | 0 | ||||||
| B | 1/21 | FFC | GA | 3.7 E Junction City | EF1 | 12.3 | 400 | 0 | 0 | ||||||
| B | 1/21 | FFC | GA | .75 SW Upson | EF2 | 5.8 | 300 | 0 | 0 | ||||||
| B | 1/21 | FFC | GA | 1 NE Upson | EF1 | 5.3 | 200 | 0 | 0 | ||||||
| B | 1/21 | FFC | GA | 4.6 NNE Thomaston | EF0 | 0.8 | 100 | 0 | 0 | ||||||
| B | 1/21 | FFC | GA | 4.6 NNE Thomaston | EF1 | 1.9 | 175 | 0 | 0 | ||||||
| B | 1/21 | FFC | GA | 5 SW Marshallville | EF1 | 9 | 100 | 0 | 0 | ||||||
| B | 1/21 | FFC | GA | 8.7 SSE Forsyth | EF0 | 9.1 | 250 | 0 | 0 | ||||||
| B | 1/21 | FFC | GA | 6 SE Fort Valley | EF2 | 14 | 250 | 0 | 0 | ||||||
| B | 1/21 | FFC | GA | 9.4 miles WSW of Danville | EF0 | 4.3 | 100 | 0 | 0 | ||||||
| B | 1/21 | FFC | GA | 4.7 miles NE of Cochran | EF1 | 4.4 | 100 | 0 | 0 | ||||||
| B | 1/21 | FFC | GA | 1 SSE Irwinton | EF1 | 5.8 | 100 | 0 | 0 | ||||||
| B | 1/21 | FFC | GA | Lake Sinclair | EF0 | 0.6 | 50 | 0 | 0 | ||||||
| B | 1/21 | FFC | GA | 9 miles N of Dublin | EF0 | 2.3 | 100 | 0 | 0 | ||||||
| B | 1/21 | FFC | GA | Milledgeville | EF1 | 0.53 | 70 | 0 | 0 | ||||||
| B | 1/21 | FFC | GA | 5.3 SE Wrightsville | EF0 | 6.5 | 100 | 0 | 0 | ||||||
| B | 1/21 | FFC | GA | 2.7 miles SSW of Tennille | EF1 | 2.5 | 300 | 0 | 0 | ||||||
| B | 1/21 | FFC | GA | 2.7 SSE Tennile | EF1 | 1.8 | 300 | 0 | 0 | ||||||
| B | 1/21 | FFC | GA | 5 miles E of Tennille | EF1 | 9 | 300 | 0 | 0 | ||||||
| B | 1/21 | FFC | GA | 1 SSW Canoochee | EF0 | 4.8 | 200 | 0 | 0 | ||||||
| B | 1/21 | CAE | GA | Midville | EF0 | 1.3 | 250 | 0 | 0 | ||||||
| B | 1/21 | CAE | GA | Rosier | EF0 | 1.5 | 100 | 0 | 0 | ||||||
| B | 1/21 | CAE | GA | Waynesboro | EF1 | 1 | 75 | 0 | 0 | ||||||
| B | 1/21 | CHS | GA | WNW Lewis | EF0 | 0.7 | 50 | 0 | 0 | ||||||
| B | 1/21 | CHS | GA | Five Points | EF0 | 0.71 | 250 | 0 | 0 | ||||||
| B | 1/21 | CHS | GA | E Sylvania | EF1 | 2.44 | 525 | 0 | 0 | ||||||
| B | 1/21 | CAE | SC | 4.5 N Barnwell | EF2 | 13.6 | 1600 | 0 | 1 | ||||||
| B | 1/21 | CAE | SC | Cope | EF1 | 5.5 | 400 | 0 | 0 | ||||||
| B | 1/21 | SHV | TX | .35 WNW Scottsville | EF2 | 7 | 230 | 0 | 0 | ||||||
| B | 1/21 | SHV | TX | 3.7 WNW Jefferson | EF1 | 0.8 | 100 | 0 | 0 | ||||||
| B | 1/21 | SHV | TX | 1.33 WSW Smithland | EF2 | 13.3 | 800 | 0 | 0 | ||||||
| B | 1/21 | SHV | LA | 3.75 ESE Plain Dealing | EF2 | 10.9 | 990 | 0 | 1 | ||||||
| B | 1/21 | SHV | LA | 3.89 SSW Shongaloo | EF1 | 3.49 | 350 | 0 | 0 | ||||||
| B | 1/21 | SHV | LA | .53 NE Natchez | EF2 | 2.05 | 300 | 0 | 1 | ||||||
| B | 1/21 | SHV | LA | 3.53 NW Colfax | EF1 | 2.25 | 150 | 0 | 1 | ||||||
| B | 1/21 | SHV | AR | 8.59 SW El Dorado | EF1 | 2.87 | 75 | 0 | 0 | ||||||
| B | 1/21 | SHV | AR | 10.94 ESE El Dorado | EF0 | 0.61 | 50 | 0 | 0 | ||||||
| B | 1/21 | SHV | LA | 9.5 SSW Georgetown | EF1 | 1.21 | 150 | 0 | 0 | ||||||
| B | 1/21 | SHV | LA | Jena | EF1 | 0.15 | 100 | 0 | 0 | ||||||
| B | 1/21 | JAN | AR | 2 WNW Hamburg | EF0 | 0.66 | 50 | 0 | 0 | ||||||
| B | 1/21 | JAN | LA | 3 N Mer Rouge | EF1 | 9.25 | 300 | 0 | 0 | ||||||
| B | 1/21 | SHV | LA | 5 SE Marion | EF0 | 0.69 | 50 | 0 | 0 | ||||||
| B | 1/21 | JAN | MS | 4 SSE Meridian Station | EF2 | 7.3 | 500 | 0 | 1 | ||||||
| B | 1/22 | BMX | AL | 1 N Hagler | EF0 | 0.03 | 200 | 0 | 0 | ||||||
| B | 1/22 | BMX | AL | Oneonta | EF1 | 1.4 | 1000 | 0 | 0 | ||||||
| B | 1/22 | CHS | GA | Willie | EF1 | 650 | 0.142 | 0 | 0 | ||||||
| B | 1/22 | JAX | GA | 10 WSW Baxley | EF1 | 0.1 | 100 | 0 | 0 | ||||||
| B | 1/22 | BMX | AL | 1 NW Shopton | EF1 | 2.2 | 330 | 0 | 0 | ||||||
| B | 1/22 | BMX | AL | 4 NE Tuskegee National Forest | EF0 | 4.92 | 200 | 0 | 0 | ||||||
| B | 1/22 | BMX | AL | 1 NE Robert G Pitts Airport | EF1 | 3.08 | 540 | 0 | 0 | ||||||
| B | 1/22 | TAE | GA | 1 S Pasco | EF2 | 18.74 | 700 | 0 | 3 | ||||||
| B | 1/22 | TAE | GA | 4 ENE Sand Hill | EF3 | 24.88 | 700 | 11 | 0 | ||||||
| B | 1/22 | JAX | GA | 11.8 WSW Baxley | EF1 | 11.1 | 1900 | 0 | 0 | ||||||
| B | 1/22 | TAE | AL | 2 WSW I-75 At Exit 22 | EF1 | 4.85 | 400 | 0 | 0 | ||||||
| B | 1/22 | TAE | AL | 2 SW Grandberry Crossroads | EF1 | 5.53 | 100 | 0 | 0 | ||||||
| B | 1/22 | TAE | GA | 2 NNE Harrisons Mill | EF2 | 12.07 | 400 | 0 | 1 | ||||||
| B | 1/22 | TAE | FL | 1 W Creels | EF1 | 2.35 | 350 | 0 | 0 | ||||||
| B | 1/22 | FFC | GA | 4 WNW Red Store Crossroads | EF3 | 70.73 | 2200 | 5 | 40 | ||||||
| B | 1/22 | FFC | GA | 3.5 miles SSW Cordele City Center | EF0 | 7.3 | 800 | 0 | 0 | ||||||
| B | 1/22 | FFC | GA | 2.5 miles S of Cochran | EF1 | 2.2 | 100 | 0 | 0 | ||||||
| B | 1/22 | FFC | GA | 1.0 miles NW of Cary | EF0 | 0.6 | 50 | 0 | 0 | ||||||
| B | 1/22 | JAX | GA | 4 miles NNE Willacoochee | EF1 | 3.03 | 1200 | 0 | 0 | ||||||
| B | 1/22 | JAX | GA | 9.5 SW Woodbine | EF1 | 16.63 | 120 | 0 | 0 | ||||||
| B | 1/23 | MFL | FL | Loxahatchee | EF1 | 18 | 130 | 0 | 0 | ||||||
| B | 1/23 | MFL | FL | Miami Springs | EF1 | 2.3 | 123 | 0 | 0 |
Search tips: While it’s not perfect, the search tool with the table above does work quite well. Try the drop downs for quick looks at various events, or by month, which NWS office has the most tornadoes and more. Typing in a rating like EF0 will bring up tornadoes of that EF-rating, and that also has a drop down. Did we mention you can stack the drop downs? Play around with it! Please note we have added “0” to track length and max width in order to allow the sorting features to work properly. “0” indicates the information is unknown.
[Tracking the current and near-term U.S. tornado risk]
What UNK means, and data may not be 100% accurate: In addition to tornadoes we have been able to confirm through NWS surveys, carried out and reported via various methods, we will also include UNK for an unknown rating. In many cases this rating will be due to tornadoes that have recently occurred — we’re talking visual or perhaps radar evidence — but have not yet been rated. The evidence is key here. We will not include reports that have not in any way been verified, even though they may be at a later time. We will include tornadoes we have seen personal evidence of, even if they are not shown elsewhere. As Storm Data is released, we will compare our numbers to those that will ultimately hit the official database next year and correct as needed. Occasionally, UNK may also be used for a tornado that is rated but its EF-scale details are left out. We go to great lengths to share accurate information, yet many of these pieces will continue to move for a while. Please consider it a bit fluid, especially when it comes to tornadoes in the past two weeks or so.
This experiment has ended
We tried. Not all projects succeed. In many cases, coming to terms with the failure is better than continuing it. After falling off the wagon of keeping up with reports, we have been compiling them in private for a future update while debating how to go about it.
The short story here is we don’t think we can offer an accurate and useful enough product to make it worth our time and effort. What we have gathered is as accurate as we can make it, but reporting standards across the National Weather Service are too messy to totally figure out as a small team of unpaid researchers.
As we’ve carried out the task of manually combining information from dozens and dozens of sources, we’ve found additional difficulties. Certain offices are very slow to update info. Often their updates will show up with no notice 6-10 weeks later. This was the case with the Dodge City area tornado event of May 24. Other offices never even report tornado details publicly.
While it is understandable that these things are fluid, especially when it involves surveying 30 or more tornadoes, our ability to track and backtrack is simply insufficient to capture everything.
We commend the folks over at Wikipedia for doing this as a group effort. It is not an easy task and the rewards are relatively limited. The project was informative, though. We have learned many lessons about how it is carried out and which offices excel at reporting tornadoes compared to others.
In the current age of data, we would like to underscore our initial hope that doing this would lead the National Weather Service to figure out a way to keep relatively updated numbers and lists going throughout the year. This data could be listed as preliminary and subject to change, but actual numbers would be hugely useful compared to reports which are often duplicated, triplicated, or even totally miss tornadoes. Reporting and response would be greatly served with better numbers throughout the year.
NWS should expedite a way to get this done. The data is already gathered. It would likely take a fraction of additional time to compile it in a sortable list fashion similar to what is presented here.
Old Imagery
As of June 9
Latest posts by Ian Livingston (see all)
- Tornado outbreaks: April, May and June peak-season primer - April 27, 2025
- Busy March for twisters to end with another multi-day event - March 28, 2025
- Everything but locusts: NWS shines in apocalyptic weather - March 17, 2025
Any chance for an update now that it’s been almost five years? 😇