
I recently detailed the 58 F5/EF-5 tornadoes that have been recorded in the United States. They are the ultimate low probability, but very high consequence weather event.
In many ways the tornadoes one step below the F5/EF-5 giants are equally dangerous, with the added problem of being considerably more likely. In fact, the modern record (1950-2011) has about nine times as many F4/EF-4 tornadoes as it does F5/EF-5. Whereas we might expect one or less of the most extreme tornado every year, F4/EF-4s are a more consistent regular in U.S. tornado climatology.
Combined, violent tornadoes make up a still rather meager 1 percent of all tornadoes, but they caused 64 percent of the deaths, and undoubtedly a very sizable chunk of the damage to property.

There were 594 F4/EF-4+ tornadoes from 1950-2011 in the United States (not including the three verified so far this year as the season is ongoing).
The 1991-2010 climatological average is seven violent tornadoes per year. In 2011, there were 23. Somewhat surprisingly, having just gone through it, that tally ranks only 4th for a yearly total. 1974 (36), 1965 (31) and 1957 (26) all saw more violent tornadoes than last year.

Constructing a climate picture through violent tornado days is more difficult than overall or significant tornado days due to the considerably smaller data set. Still, we can at least look at yearly values of violent tornado days. When doing so, we see the 2000s (so far) noticeably absent from the top-5 list. 1957 had 19 to top the group and 2005 had one at the bottom.
The current (1991-2010) average for violent tornado days is 4.6 per year. Looking at 10-year periods, the 2001-2010 decade had the lowest average number of days with violent tornadoes, or only 4.3 per year. Curiously enough, considering it’s likely under-representation of tornadoes overall, the 1951-60 period had a peak of 8 days which later held steady at 6.7 from 1961-70 and 1971-80. 2011 had six, but of course lots of ’em packed into one day.

Violent tornado season has similar characteristics to tornado season as a whole, though its peak appears to be skewed earlier, likely in part to April’s tendency to have large outbreaks with multiple violent tornadoes — the obvious recent examples of April 2011 and April 1974. May holds the second place spot for overall violent tornadoes, with June in third. The numbers plummet into July and stay low through the next spring. However, every month has seen them.
 About 62 percent of all violent tornadoes killed people from 1950-2011 (2 of 3 have done so this year). Oklahoma holds a slight edge on Alabama with 40 killer violent tornadoes* to 39. Texas has seen 30, Tennessee 29, Arkansas, Kansas and Missouri 23. Indiana will officially join that list once the season is over with 23 as well (unless there are additional on top of the one so far).
A killer tornado in the South is not necessarily the same as one in Oklahoma. When looking at how many people were killed in the top-2 killer violent tornado states, we see that 582 died in 39 tornadoes that impacted Alabama while 364 died in the slightly greater (40) number of Oklahoma tornadoes.
Those numbers are of course skewed by larger tornado casualty events (both states have had them). In that light, another comparison between the states can be made between overall violent tornadoes which have impacted either state and those which caused death. In this measure, 89% of violent tornadoes that have impacted Alabama have caused deaths while 63% which hit Oklahoma have.
Oklahoma’s stat is pretty close to the overall national average of violent tornadoes while Alabama’s is almost staggeringly high.
Deadliest violent tornadoes since 1950
5/22/2011, Missouri, EF-5, 158 killed
6/8/1953, Michigan, F5, 116 killed
5/11/1953, Texas, F5, 114 killed
6/9/1953, Massachusetts, F4, 90 killed
5/25/1955, Oklahoma/Kansas, F5, 80 killed
4/27/2011. Alabama/Tennessee, EF-5, 72 killed
4/27/2011. Alabama, EF-4, 64 killed
3/3/1966, Mississippi/Alabama, F5, 58 killed
2/21/1971, Mississippi/Tennessee, F4, 58 killed
3/21/1952, Arkansas, F4, 50 killed
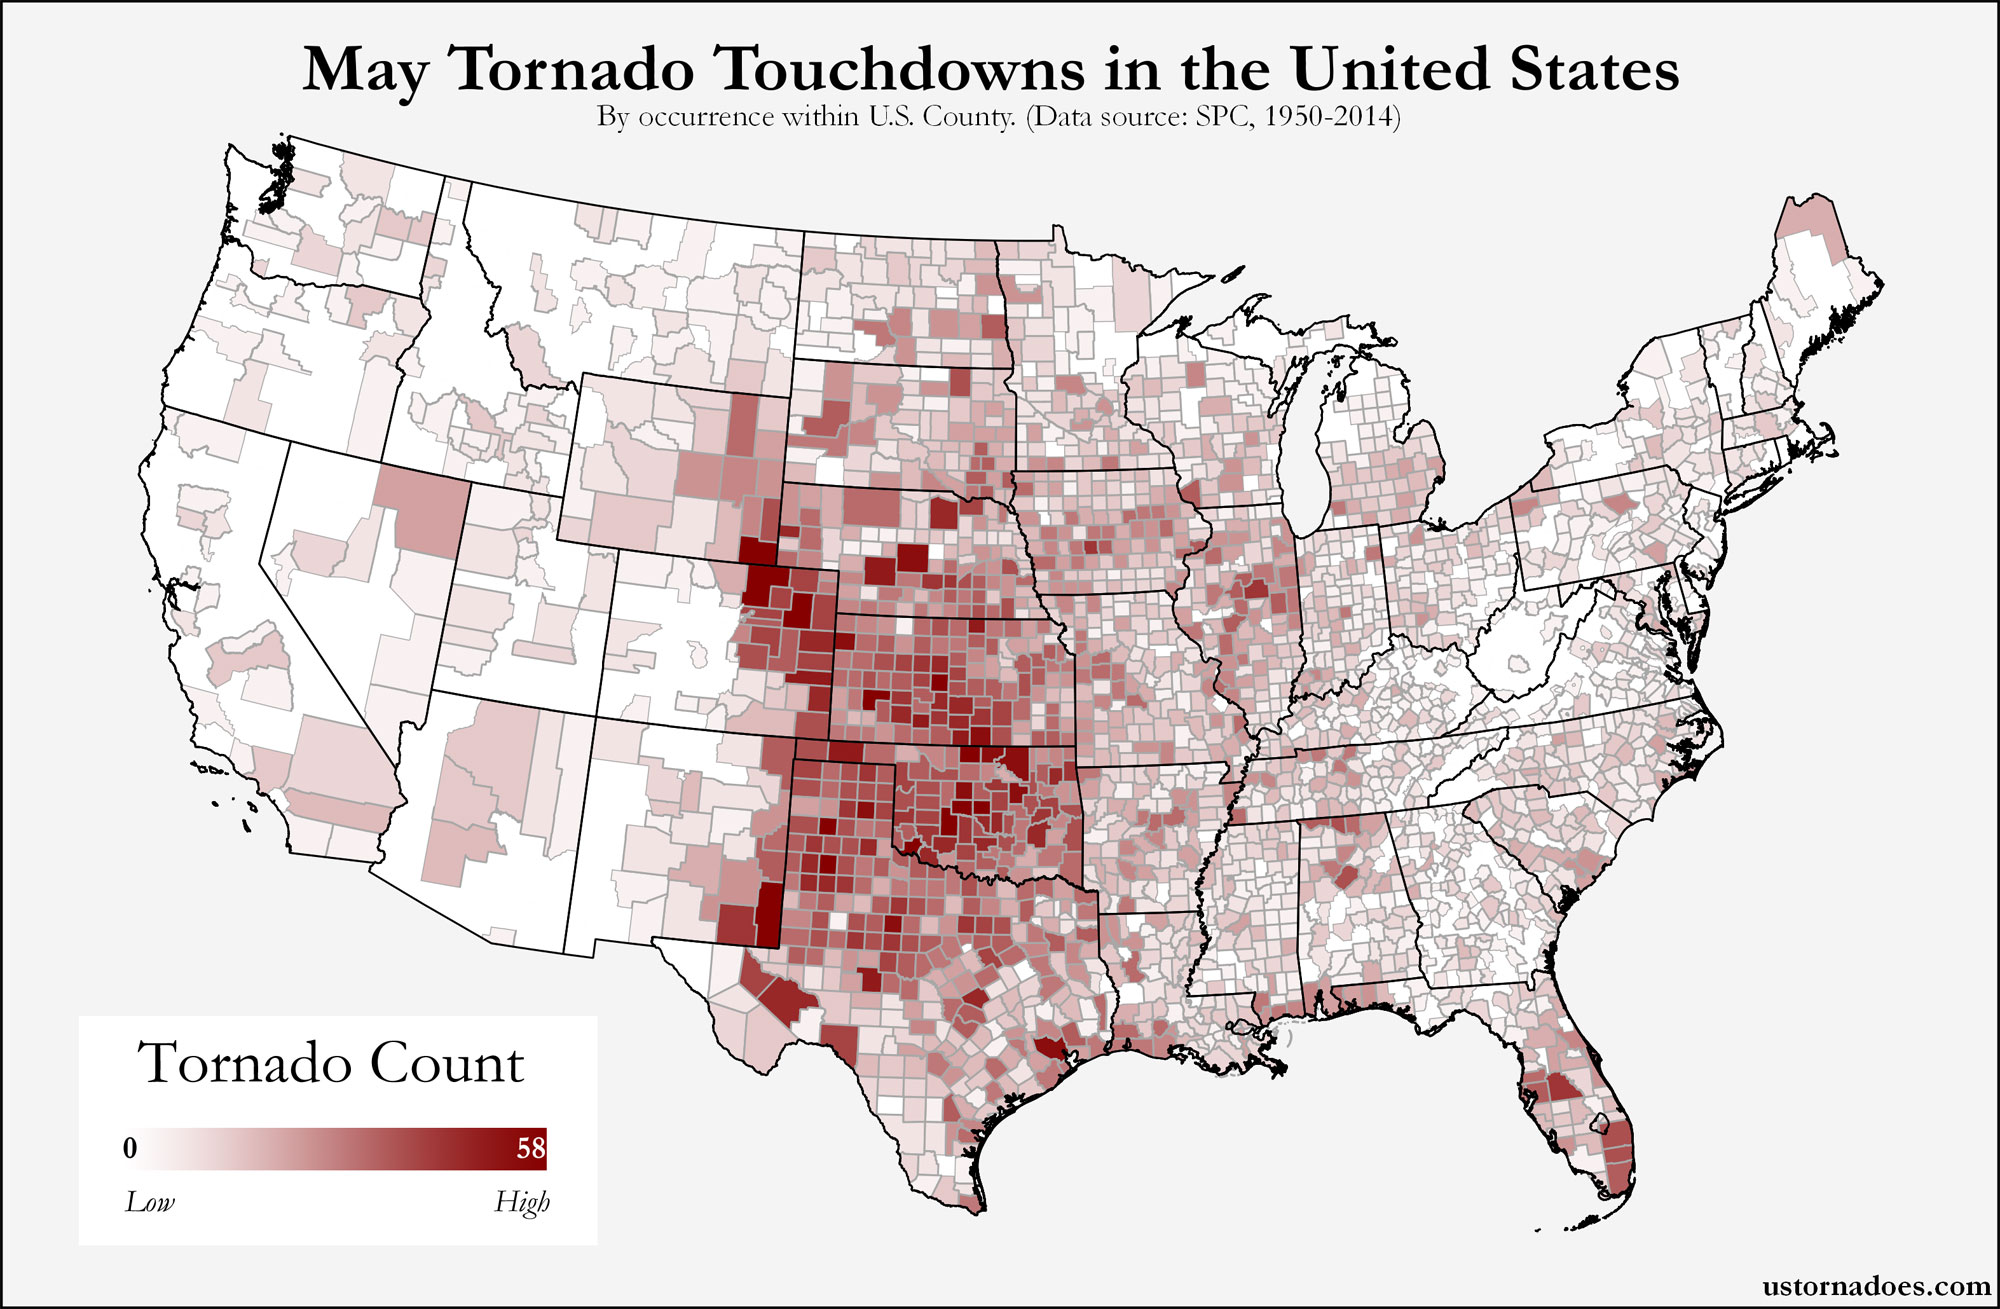
Back to the map and how various places rank on the violent tornado scale.
Just eyeballing it, northern Alabama is strongly painted, as is central Oklahoma into central Kansas. Numerous lines crisscross Iowa and parts of the Ohio Valley. Missouri has an emptier zone in the middle but its edges are heavily lined. The weight is to the east of the Continental Divide and west of the Appalachians, yet there are a number on the East Coast.

Taking hard counts of violent tornado hits into consideration, Oklahoma leads the list with 63. Runner up Texas has seen 52, and Iowa makes perhaps a surprise run at 3rd with 50. Kansas comes in at 46, and Alabama at 44, thus rounding out the top-5 states for violent tornadoes touchdowns or pass-throughs.
 When looking at the top-10 of states hit by violent tornadoes, then taking violent tornado counts per 10,000 square miles, Oklahoma and Iowa are roughly tied for the lead with 3.5 violent tornadoes per 10,000 square miles from 1950-2011. Texas falls much lower in this count and would be under top-20 on this metric overall, but that also includes some very small states like Connecticut which have seen very few, but countable, violent tornadoes.
In an attempt to disaggregate the larger events which might paint the map more than other more “regular” occurrence of F4/EF-4+ tornadoes, a thorough examination of states impacted during regional outbreaks of three or more violent tornadoes was done.
222 (37 percent) of the 594 violent tornadoes, 1950-2011, came during one-day outbreaks (some were preceded or followed by additional in other days) including three or more violent tornadoes. There were a total of 42 “convective day” (defined as 12 UTC on day one to 11:59 UTC the following day) violent tornado outbreaks since 1950 (see list at end).
These 42 events — we’ll call them ultra-violent tornado days — alone caused 34 percent of all tornado deaths during the 1950-2011 period and 53 percent (more than their fair share) of all F4/EF-4+ tornado deaths in that same set of years.

The top-5 states for outbreaks of this type from 1950-2011 were Tennessee (9 events), Iowa (8 events), Mississippi (7 events), Oklahoma (7 events) and Arkansas (6 events).
Looking at the maximum number of violent tornado strikes during a given event with three or more such tornadoes, there was a range from 11 in Alabama (April 2011) and Kentucky (April 1974) to one in a number of states. Indiana (nine in April 1974) and Pennsylvania (seven in May 1985) round out the top-4 of this grouping, with five states coming in at five a piece.
 When it comes to the top-10 states for overall violent tornado hits (inclusive of those with 29+ through 2011), we see both Indiana and Tennessee primarily in the game during outbreaks that produced three or more violent tornadoes with, respectively, 75 percent and 71 percent of all violent tornado strikes occurring on these days. Alabama, Mississippi and Illinois are about half and half, but weighted toward the smaller events.
Four of the top-5 overall violent tornado states — Iowa, Oklahoma, Texas and Kansas — see a strong majority of their violent tornadoes on days with two or less. Missouri, home to the Joplin disaster in 2011, was ranked 6th overall for violent tornadoes and had the lowest percentage — only 15 percent — of all of the top-10 states when it came to ultra-violent tornado day F4/EF-4+ tornadoes.
Since they fall at each end of the spectrum among violent tornado states, taking a look at Missouri and Indiana specifically, we see that of Missouri’s 41 violent tornadoes, they came on 35 separate days. In Indiana, the 32 violent tornadoes came on 13 days. It’s interesting to note such differences between states that are relatively close to each other. One has to at least wonder if it has to do with population distribution differences (i.e., humanity for violent tornadoes to hit — though they’re not necessarily “missed” as they might have been in the past).
 Regardless, that’s a difference of a violent tornado day average of just over 1 violent tornado for Missouri compared to a violent tornado day averaging 2.5 violent tornadoes in Indiana. In essence, the average Indiana violent tornado day meets the criteria for the 42 outbreaks noted above and listed at bottom.
This is a topic that could go on and on despite the relatively small sample set, but before getting to that point, let’s wrap with a quick look at areas of violent tornado activity that are removed from the central U.S.
All but two of the Pennsylvania violent tornadoes were associated with the unusual outbreak of May 31, 1985 that dropped seven violent tornadoes on Ohio, Pennsylvania and New York. Two other incidents of one violent tornado have impacted that state.
Massachusetts, which has been hit by three separate violent tornadoes, has never seen more than one in a day since 1950. As seen in an offset quote section above, one of the deadliest violent tornadoes in the modern record hit Massachusetts, destroying parts of Worcester. Connecticut has also seen multiple (two) violent tornadoes on separate occasions.
The Carolinas, and to a lesser extent as far north as near Washington, D.C., fall in a fairly active tornado region. A number of both larger outbreaks including multiple violent tornadoes and individual violent tornado events have impacted South Carolina and North Carolina. One of the more famous East Coast violent tornadoes of recent slammed La Plata, Md. just a short jog south of the Nation’s Capital.
Outbreaks with over 3 violent tornadoes since 1950 (42 total)
4/3/1974, 30 (Kentucky, Indiana, Alabama, Tennessee, Georgia, Ohio, N.C. [1 secondary])
4/11/1965, 17 (Iowa, Illinois, Mississippi, Indiana, Ohio)
4/27/2011, 15 (Alabama, Mississippi, Georgia, Tennessee)
3/21/1952, 10 (Arkansas, Tennessee, Missouri, Mississippi)
3/28/1984, 7 (South Carolina, North Carolina)
5/31/1985, 7 (Ohio and Pennsylvania)
6/2/1990, 7 (Illinois, Indiana, Ohio [1 secondary])
3/1/1997, 7 (Arkansas, Tennessee)
4/21/1967, 5 (Missouri, Illinois, Michigan)
4/26/1991, 5 (Kansas, Oklahoma)
2/5-6/2008, 5 (Arkansas, Tennessee, Alabama [3 on 5th, 2 on 6th same “convective day”])
6/8/1953, 4 (Michigan, Ohio)
4/3/1956, 4 (Wisconsin, Tennessee, Michigan)
5/6/1965, 4 (Minnesota)
4/30/1967, 4 (Iowa, Minnesota)
5/15/1968, 4 (Iowa, Arkansas)
4/17-18/1970, 4 (Texas [3 on 17th, 1 on 18th same “convective day”])
4/2/1982, 4 (Oklahoma, Texas, Arkansas, Missouri)
3/13/1990, 4 (Kansas, Iowa, Nebraska)
5/3/1999, 4 (Oklahoma, Kansas)
5/4/2003, 4 (Kansas, Missouri, Tennessee)
6/17/2010, 4 (Minnesota, North Dakota)
5/24/2011, 4 (Oklahoma, Arkansas)
5/1/1953, 3 (Alabama, Tennessee) [2 on 1st, 1 on 2nd same “convective day”])
5/10/1953, 3 (Iowa, Minnesota [1 secondary], Wisconsin [1 third])
5/25/1955, 3 (Texas, Oklahoma, Kansas [2 secondary])
12/18/1957, 3 (Illinois)
6/4/1958, 3 (Wisconsin)
5/5/1960, 3 (Oklahoma)
5/8/1965, 3 (Nebraska, South Dakota)
4/23/1968, 3 (Kentucky, Ohio)
2/21/1971, 3 (Louisiana, Mississippi, Tennessee [1 secondary])
3/20/1976, 3 (Illinois, Indiana, Michigan)
3/26/1976, 3 (Oklahoma, Mississippi)
5/4/1977, 3 (Missouri, Iowa)
5/5/1989, 3 (South Carolina, North Carolina)
11/21/1992, 3 (Texas, Mississippi [2 on 21st, 1 on 22nd same “convective day”])
11/22/1992, 3 (Georgia, Kentucky, In. [1 secondary] [4 on 22nd, 1 previous “convective day”])
5/27/1995, 3 (Iowa)
6/8/1995, 3 (Texas)
4/8-9/1999, 3 (Iowa, Ohio [2 on 8th, 1 on 9th same “convective day”])
11/24/2001, 3 (Mississippi, Alabama)
=-=-=-=-=
Notes…
*In this analysis, I’ve counted killer tornadoes and the states they impacted without checking if tornado fatalities were caused in that state. Once a killer tornado always a killer tornado. If in the future we press into deeper detail we will deconstruct this data.
-I have perused the academic literature on this subject in only a fairly cursory manner and largely after the fact of writing. Experts like Chuck Doswell and Harold Brooks are the authoritative individuals on subjects such as these. Much of what I’ve seen is somewhat dated and I’ve attempted to examine things differently. Some methods such as grouping into states rather than regions within or between states may simplify matters a bit, but overall it appears any findings which are similar here and with noted experts are more or less consistent.
-It’s certainly possible the record of intense to violent tornadoes is skewed to the low-end of reality. The high-end ratings are easier to determine when structures are impacted. It’s also possible, despite recent apparent dips in activity outside 2011, that we’ll find more EF-4+ in the future as development of tornado zones continues.
SPC tornado data obtained at the Tornado History Project. Graphs can be selected for larger versions. Official 2012 data will be available during spring 2013. Get updates about U.S. Tornadoes on Twitter and Facebook.
Latest posts by Ian Livingston (see all)
- Top tornado videos of 2023 - January 1, 2024
- March 31, 2023 tornado outbreak videos - March 31, 2023
- Top tornado videos of 2022 - December 31, 2022
6 thoughts on “Violent F4/EF-4 and F5/EF-5 Tornadoes in the United States since 1950”