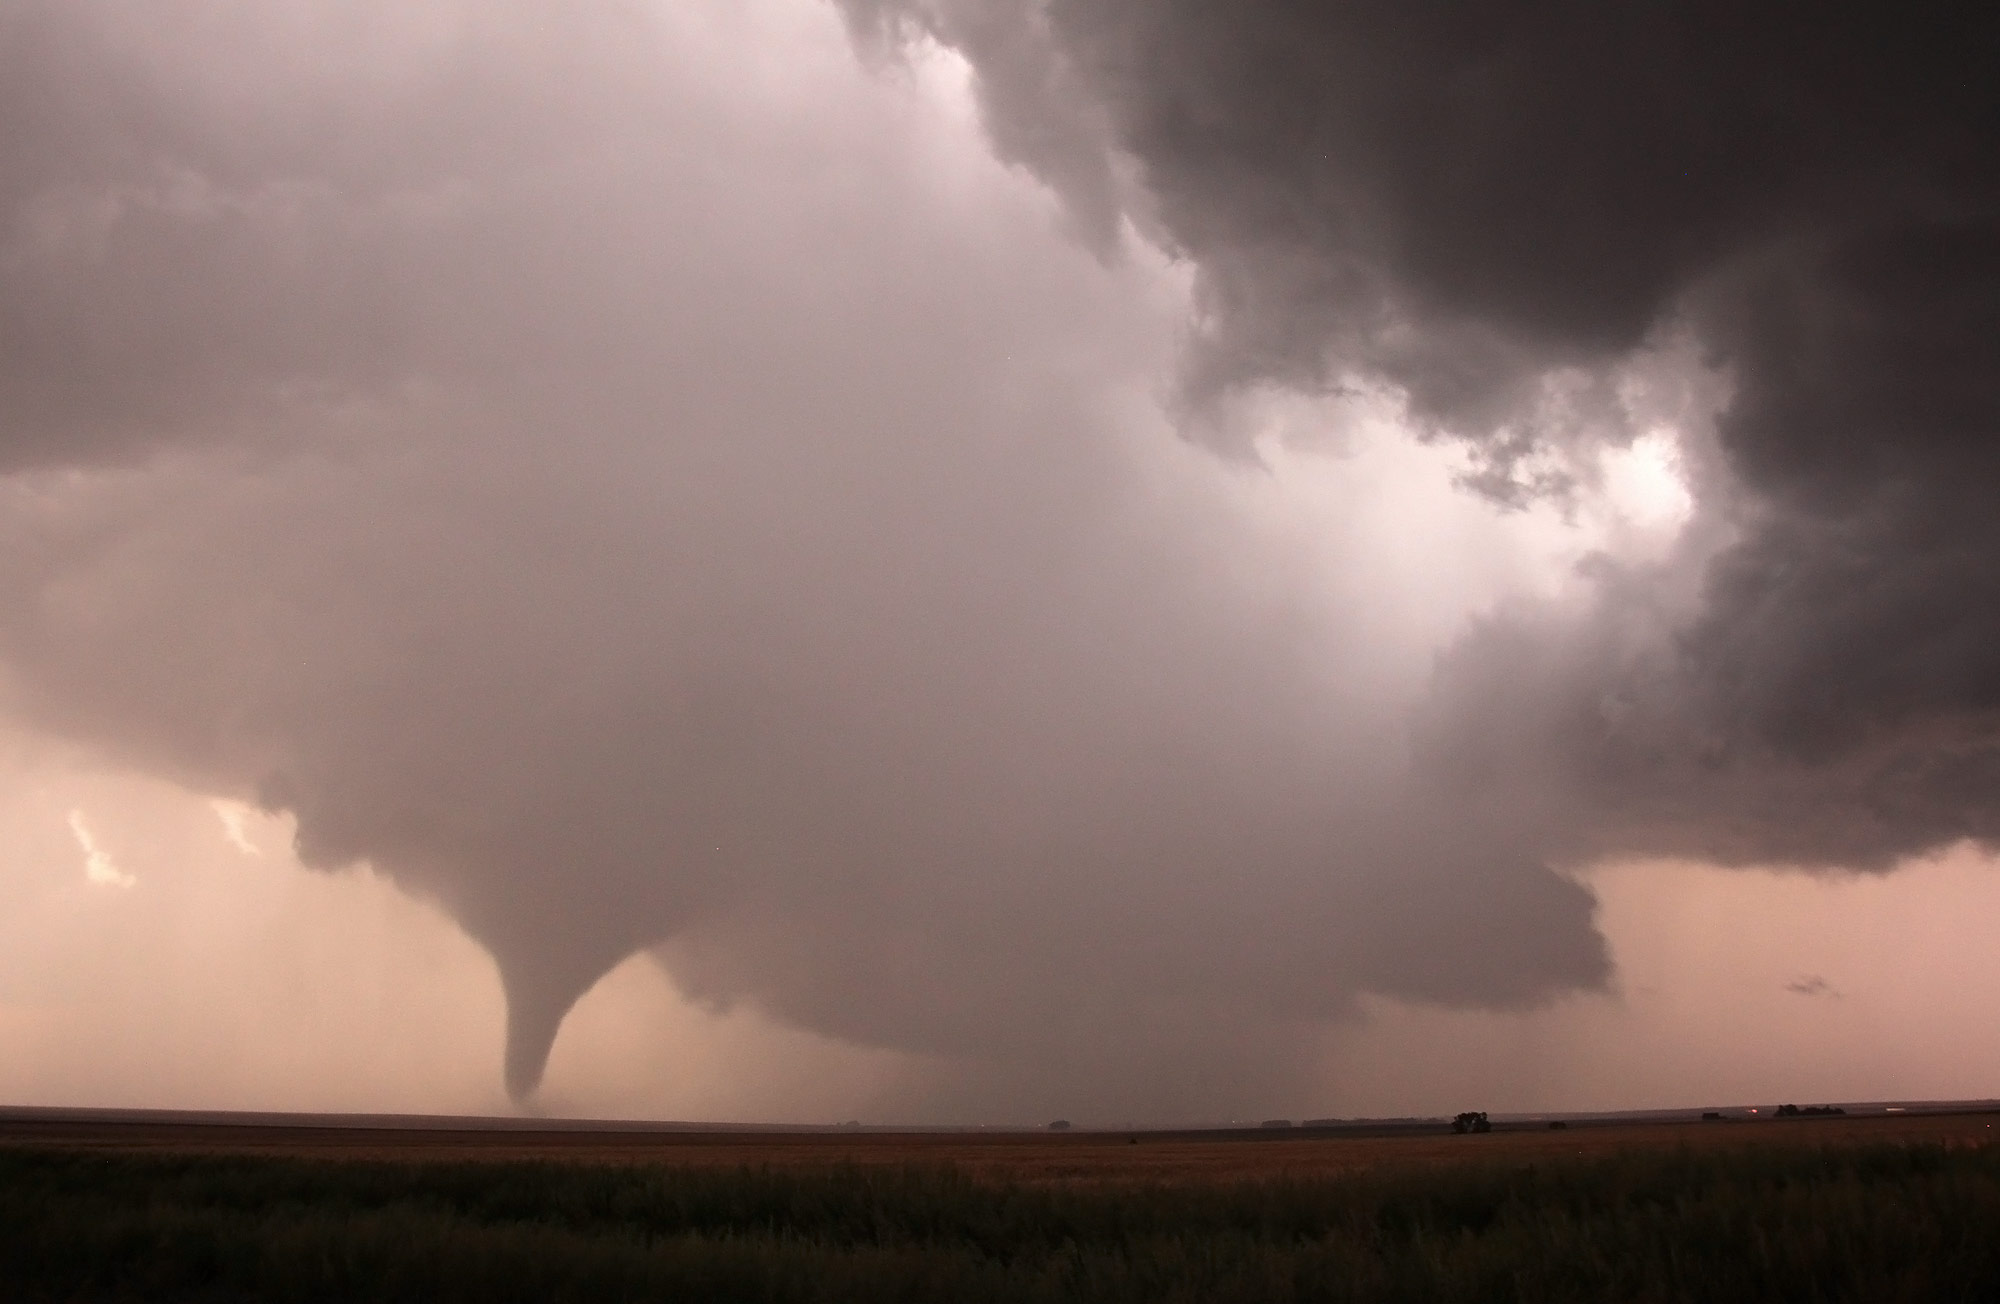
Throughout the historical period, September continues the late-summer trend of fewer significant (F2/EF-2+) tornadoes. It’s top end year is not too dissimilar to August, though interestingly enough, there are more top-end years than August. However, it is also comparatively “hit or miss,” with many low production years intermixed with a few high ones. These tornadoes, as in all months, contribute much past their numbers to deaths and destruction.
September Significant Tornado Climatology (1950-2011)
Total significant tornadoes: 488
September high: 30 (1961)
September low: 0 (1987, 2003, 2009)
1991-2010 climatological average: 6.1
1991-2010 median: 4.5
Perhaps notably, and also seen with other months like August, the years in which no significant tornadoes occurred were all pretty recent — two came during the 2000s. Also, as with other strong tornado trends, the linear direction is downward over time. At least some of this is attributable to increased rating standards.
When it comes to the breakdown by state, Texas holds a considerable lead, as in many months thanks in large to its size advantage. Other than Texas, the only top five overall state for September tornadoes that remains in the top five for strong tornadoes in Kansas. Iowa jumps from 11th overall in the month to 2nd for strong tornadoes, with Wisconsin also featuring a similar jump. Interestingly, an East Coast state — Virginia — rounds out the group of leaders, with about 25 percent of all its September tornadoes ranking in as strong.
There have been 76 F3/EF-3 tornadoes in September, or roughly 2.5% of all tornadoes in the month. Seven states have seen five of more F3/EF-3 tornadoes in September since 1950, with the East Coast state of Virginia again taking hold of one of the top spots.
Violent tornado statistics are more or less on par with August, which means much lower than peak season. With two fewer, including no F5/EF-5s, mean the overall ratio of violent tornadoes to all tornadoes is a paltry 0.4 percent. The Midwest, southern Plains and Ohio Valley appear most favored, though the numbers are too small to make many generalizations. September is one month where violent tornadoes do not account for an overwhelming percentage of the deaths, coming in right around 20 percent.
U.S. Tornado Climatology by Month
All: Jan | Feb | Mar | Apr | May | Jun | Jul | Aug | Sep | Oct | Nov | Dec
Significant: Jan | Feb | Mar | Apr| May | Jun | Jul | Aug | Sep | Oct | Nov | Dec
SPC tornado data obtained at the Tornado History Project. Images can be selected for larger versions. Get updates about U.S. Tornadoes on Twitter and Facebook. Official 2012 data will be available during spring 2013.
Latest posts by Ian Livingston (see all)
- Top tornado videos of 2023 - January 1, 2024
- March 31, 2023 tornado outbreak videos - March 31, 2023
- Top tornado videos of 2022 - December 31, 2022