The “Super Outbreak of April 3-4, 1974” occurred across portions of the Midwest, Lower Mississippi Valley, and Southeast. In what was the worst tornado outbreak of the 20th century, there were 148 tornadoes over the course of just 18 hours, over half of which were classified as significant/strong at F2 strength or higher.
Many comparisons have been made between this outbreak and the April 25-28, 2011 outbreak which featured 358 tornadoes. Although the more recent outbreak featured many more tornadoes, they occurred over a longer time period in an age of better tornado detection, and the worst was confined to a smaller area compared to April 3-4, 1974.
Perhaps the most staggering fact from the 1974 outbreak was the amount of F4 and F5 tornadoes; an incredible 30 (23 F4s and 7 F5s). The 1974 outbreak featured 30 violent tornadoes in less than one day when the national average is only about 7 per year.
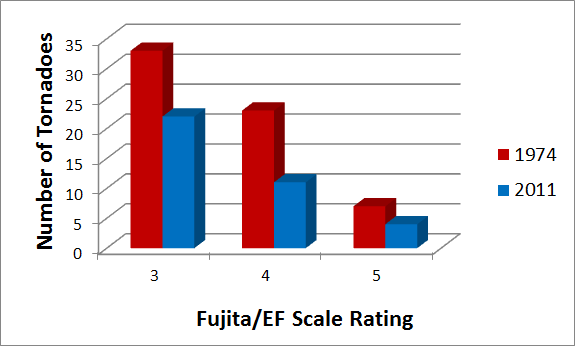
The chart above displays a comparison of the most intense tornadoes (F/EF3 or higher) between the 1974 and 2011 outbreaks. In all of these categories, 1974 prevails with ease. Tony Lyza provided a more detailed numerical breakdown comparing the number of significant tornadoes between the 1974 and 2011 outbreaks in a post last year.
The April 1974 outbreak has been reviewed, discussed, and analyzed ad nauseum throughout the meteorological community over the years: from the meteorological set-up, to climatological comparisons, to NOAA and National Weather Service reviews.
This article looks at the April 1974 outbreak from a different, visual perspective. I use maps to first look at the event from the past, then present the same information with a fresh face using some thought-provoking interactions and overlays.
The First Super Outbreak Map Ever Made
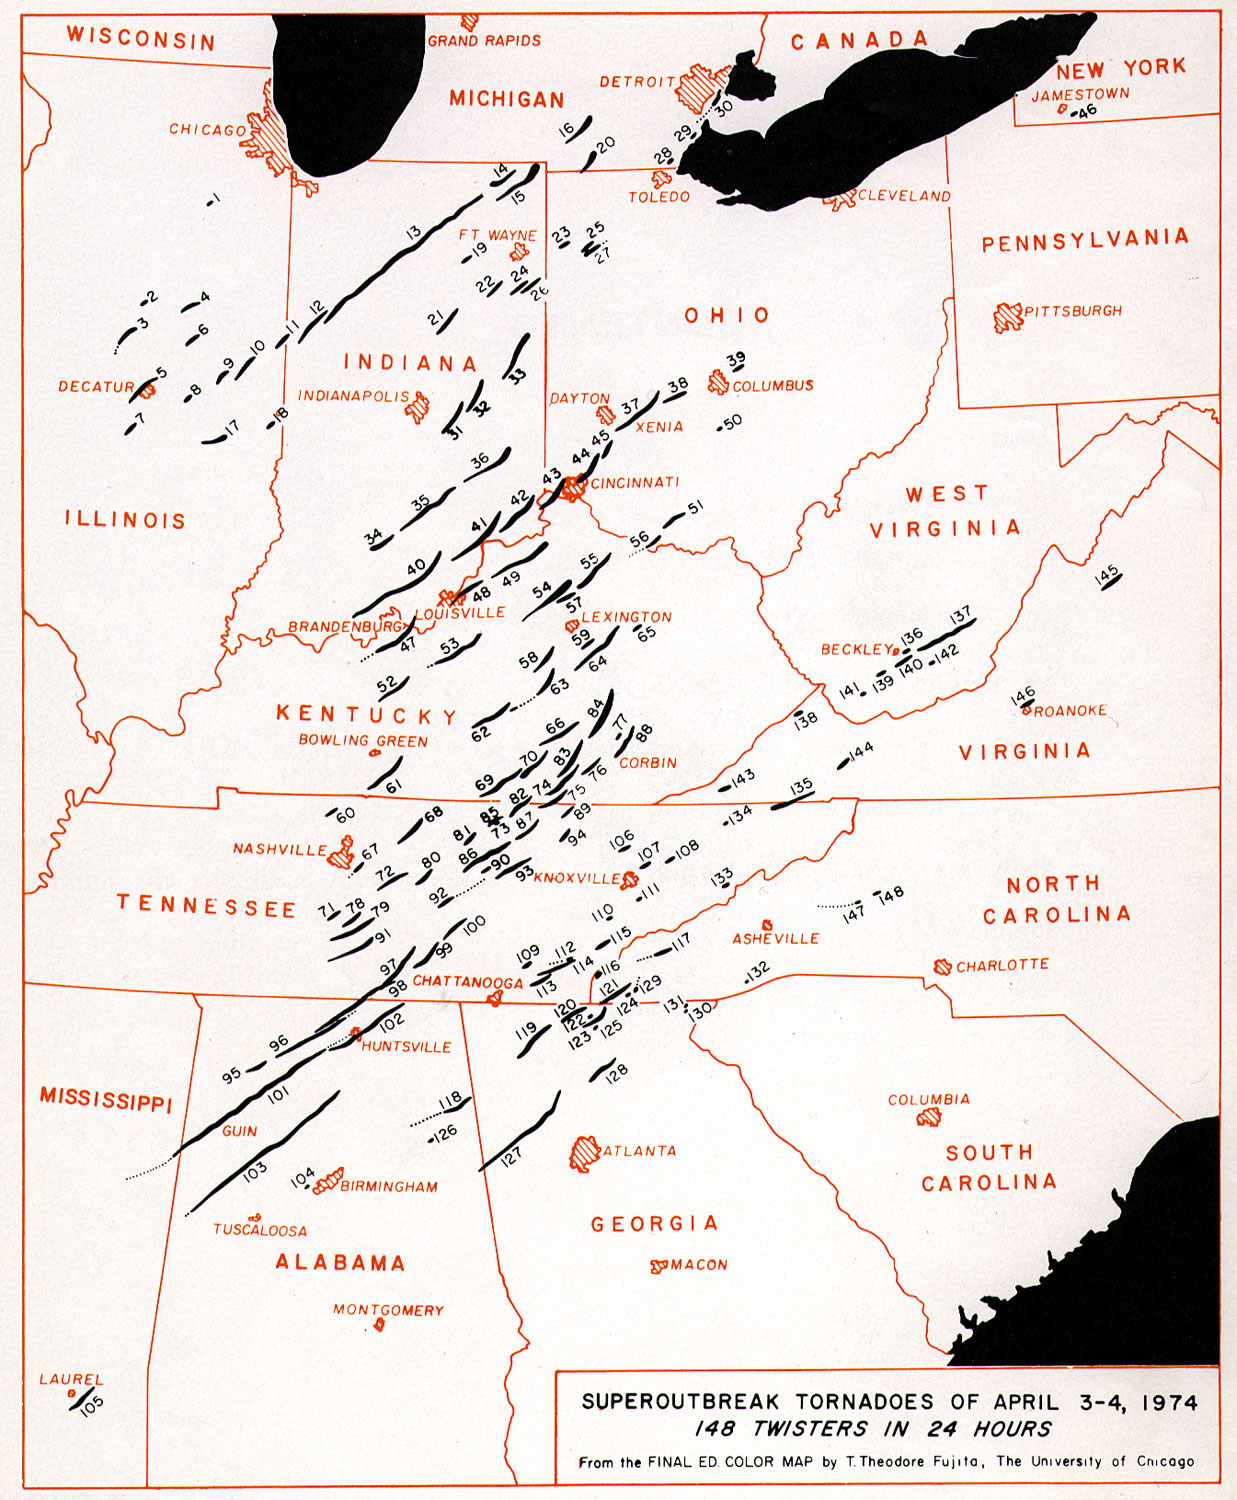
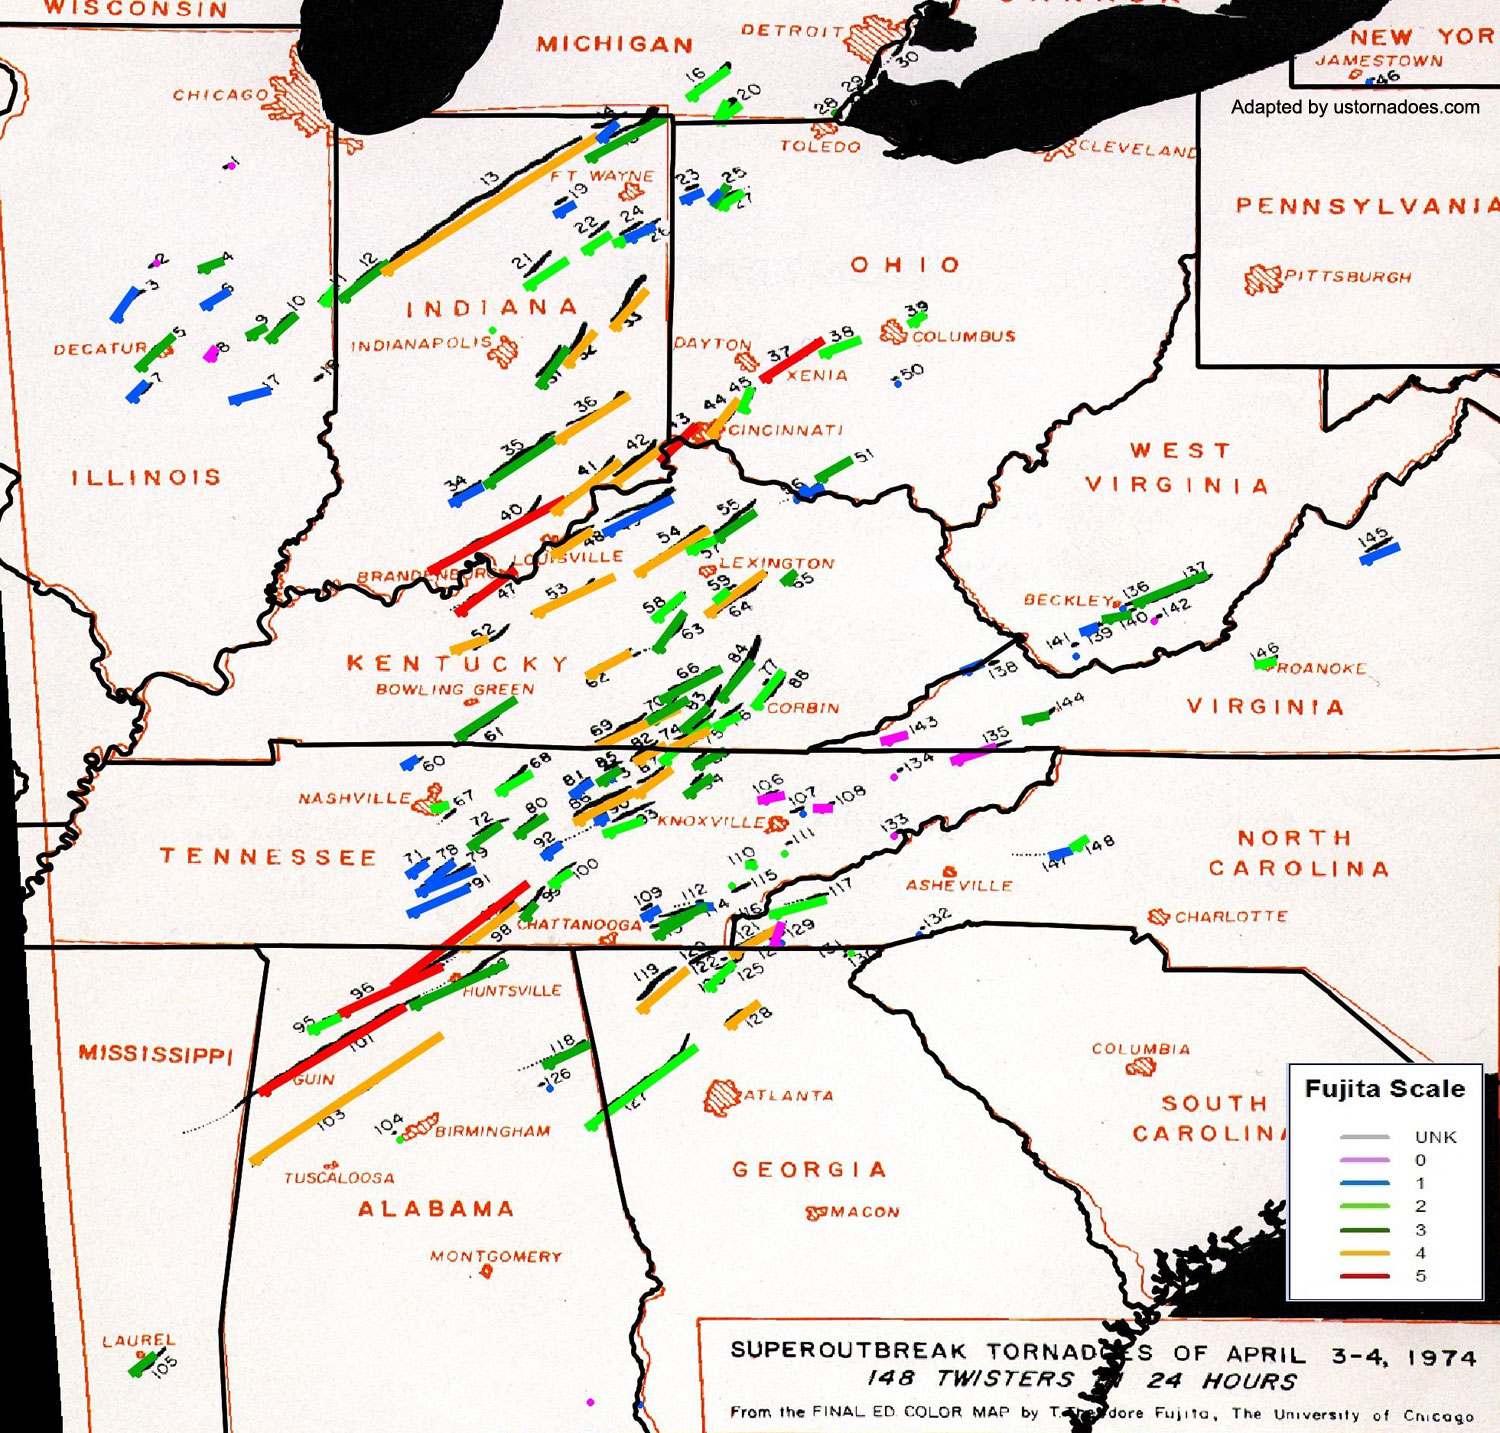
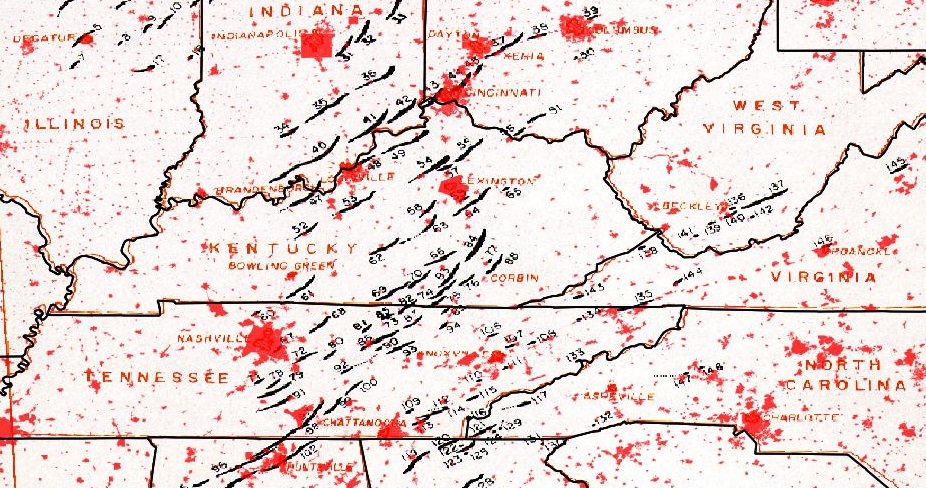
The first map ever made of the April 3-4, 1974 event was done by the renowned Ted Fujita when he was affiliated with the University of Chicago. He personally surveyed most of the tornado paths and produced this hand-drawn map with impressive detail and acuity.
Popular Maps of the Event
As already mentioned, meteorologists have been studying this event for close to 40 years. Below are maps from NOAA and the Tornado History Project that are popular resources and available to the public. Both maps are great visual representations of the event, as they symbolize the individual tornado tracks rated according to the Fujita Scale.
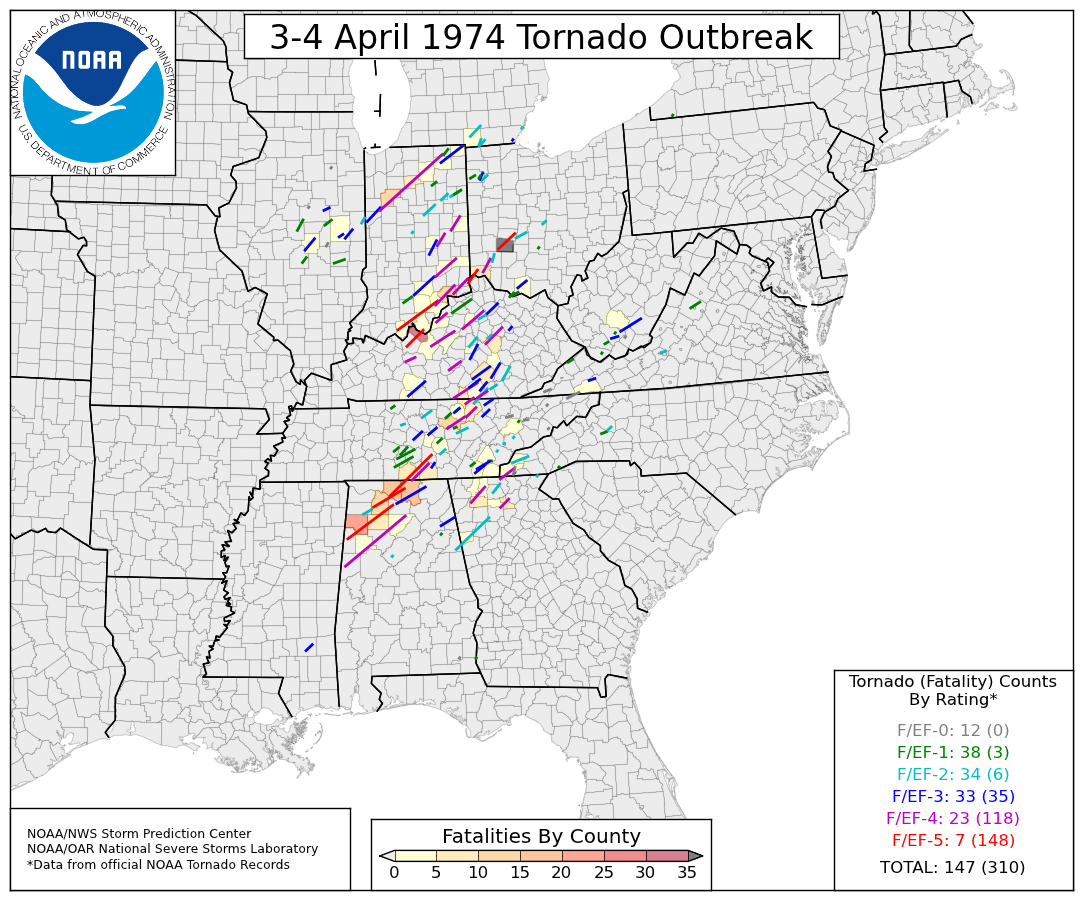
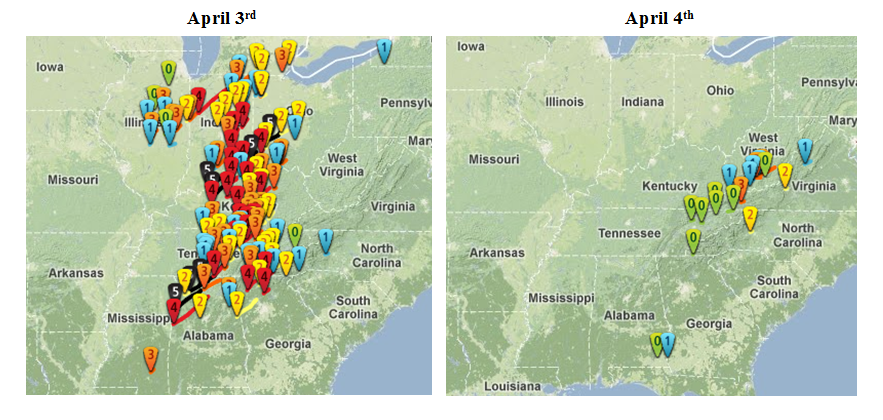
Both maps above provide a good reference of the spatial distribution of the tornadoes as well as distribution of the different tornado strengths. The greatest concentration of tornadoes occurred over portions of Indiana, Ohio, Kentucky, and Tennessee.
All seven F5 tornadoes occurred on the 3rd, and Alabama was the state that experienced the highest number of F5 tornadoes that day; three out of seven. The other F5 tornadoes occurred throughout Kentucky, Indiana, and Ohio. Here is the final confirmed tornado count and breakdown according to Fujita categories:

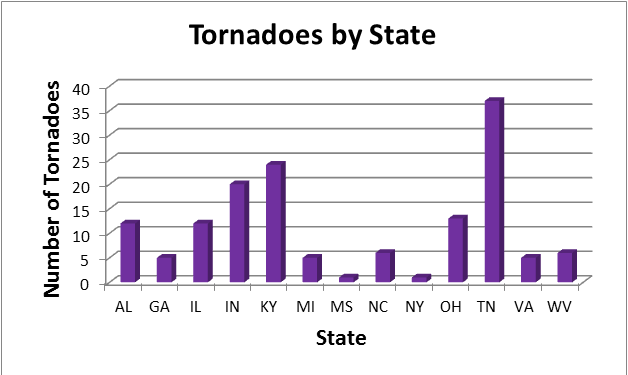
And here is a chart showing the distribution of tornadoes by state; 13 states total. Tennessee experienced the most tornadoes out of any other state, with 37.
New Perspectives
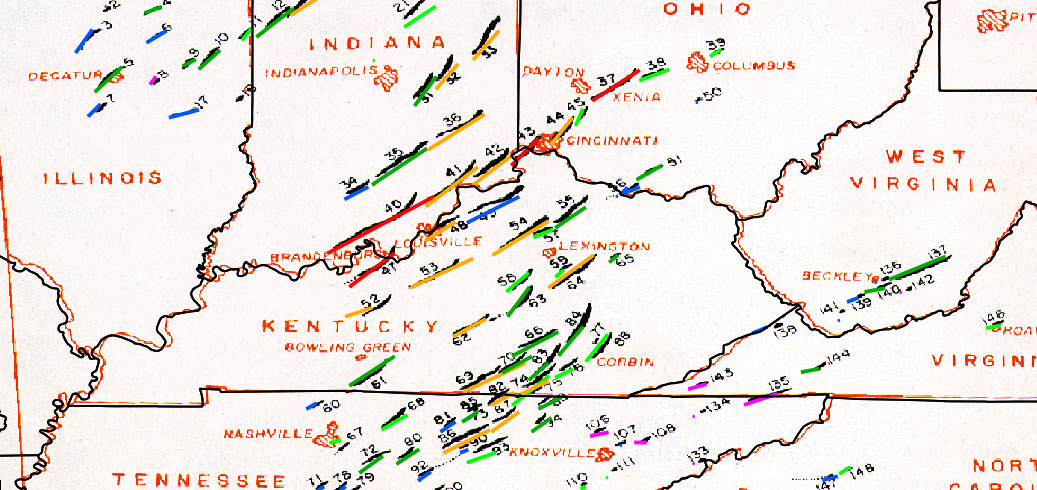
The first map interaction involves overlaying the tornado tracks symbolized according to the my color scheme above (see legend) on top of Ted Fujita’s original tracks. Adding the color information helps enhance Fujita’s hand-drawn tracks while still maintaining the historical map feel.
Here is a zoomed in version of the same map:
A second map interaction of interest investigates a “what if this happened tomorrow?” scenario. In other words, given the current population distribution and the urban sprawl around major population centers what areas would be hardest hit if this same outbreak happened today?
The map below involved overlaying urban areas according to the 2010 Census on top of Ted Fujita’s original track map.
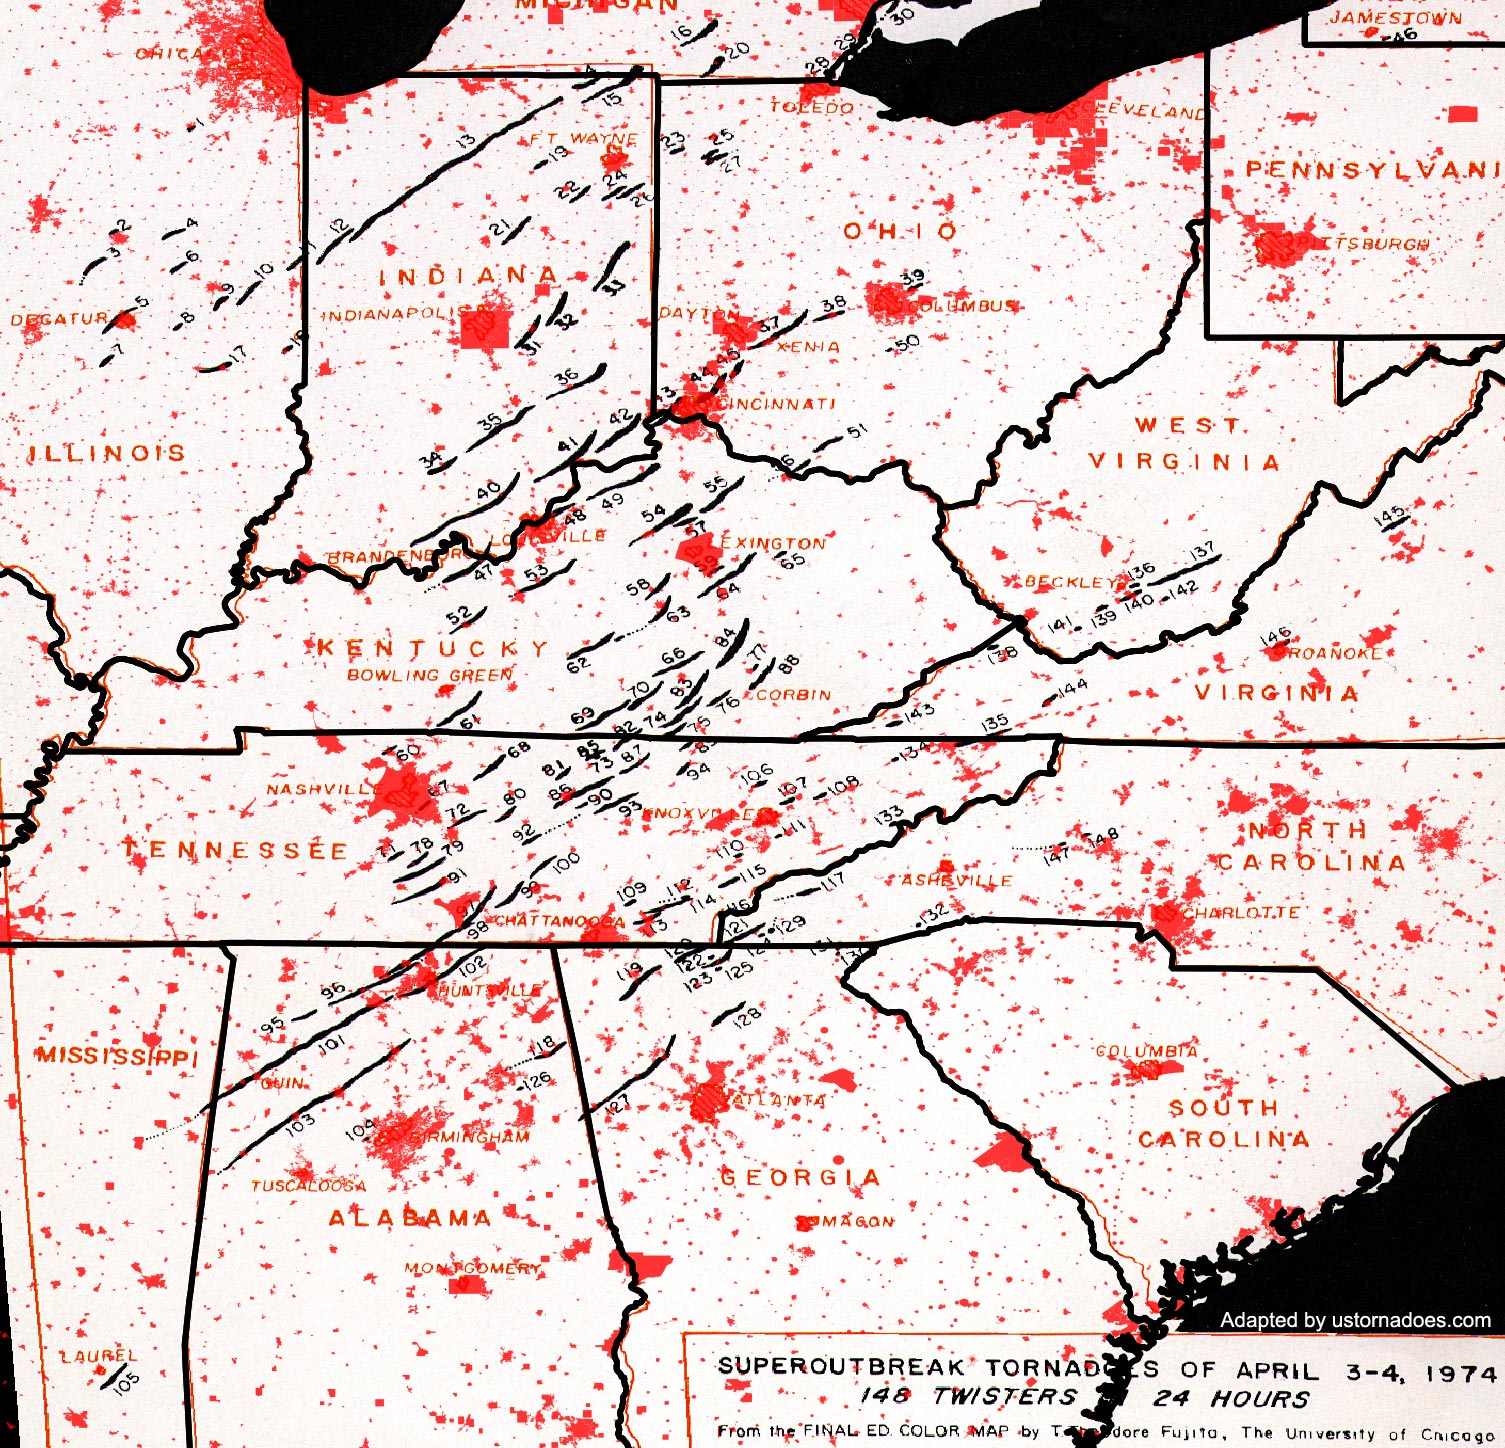
While U.S. population has not necessarily exploded since 1974, urban sprawl has undoubtedly become more prevalent. By looking at the map, it is easy to see which urban areas would be devastated if this outbreak occurred today.
On the northern edge of the outbreak Decatur, Illinois and the suburbs of Cincinnati, Ohio are hit hard. On the eastern edge of the outbreak area Roanoke, Virginia, a city which has significantly expanded both in size and population since 1974, would experience major damage from the tornado that struck the town in the early hours of the 4th.
Moving south across Kentucky, the northern suburbs of Louisville and southern suburbs of Lexington are impacted; these areas of Kentucky were hit hard by the March 2nd, 2012 outbreak. Moving south still, the suburbs of Nashville are devastated by multiple tornadoes. Finally, at the southern edge, Hunstville, Alabama would likely sustain catastrophic damage from one of the long-track F5 tornadoes.
Here’s a zoomed in version of the map to better see some of the urban areas:
Conclusion
For at least certain benchmarks, the Super Outbreak of April 3-4, 1974 remains as THE tornado outbreak that all other tornado outbreaks are compared to. April 25-28, 2011 was compared to 1974 in terms of the atmospheric set-up (both occurred in a La Nina pattern) and also compared in the number, spatial distribution, and intensity of the tornadoes.
Given the ferocity and destruction associated with these large-scale tornado outbreaks, tornado researchers wonder if these events will remain as once-in-a-generation events, or if they will happen more (or less) frequently. In a country that experiences 75% of the world’s tornadoes each year, it is well worth reviewing these big outbreaks on their anniversaries.
References:
http://www.tornadohistoryproject.com/
Additional reading:
NWS Survey report: http://www.april31974.com/TornOut.pdf
Latest posts by Kathryn Prociv (see all)
- Halloween tornadoes: The spooky historical facts - October 28, 2013
- From domestic to international: Tornadoes around the world - July 25, 2013
- Cialis und Wetter : Leidenschaft bei jedem Wetter und in jeder Jahreszeit - July 25, 2013
Great writeup KP!!
Thank you Chris!
I witnessed the one in Huntsville when it hit a school. I was on my brother’s shoulders and we were approx 1.5 miles away. It glowed flourescent green when it hit the school and we figured it was the flourescent light bulbs being sucked up. That was a monster storm and it was so bright we could make it out completely in the dark. I’ll never forget that night! I’ve seen lots of destruction as a news photographer, but none has ever compared to that event.
Interesting! Kathryn, a few questions:
How many fatalities?
Was there any advanced warnings or even forecasts of the potential threats?
The tracks overlaid on the 2010 census are interesting, although some such as 43 44 47 and 48 look like they may still have hit urban areas near the city centers of Cincinatti and Louisville. Did urban areas actually get hit?
Like the website! (I follow you all on CWG as jimmytrain21)
I know Louisville got hit hard near downtown. I have pictures of the aftermath. Also my mom was in one of the taller buildings in downtown and saw it coming.
Hi Jimmy! Glad to have you over here! To answer your questions:
There were 319 fatalities
My understanding is there was some advanced warning in that forecasters had an idea a tornado outbreak was coming. However, Doppler Radar was not yet invented so forecasters were having to issue warnings based off of radar signatures (such as the hook echo) or reports of confirmed tornadoes on the ground.
You’re right in that some urban areas were in fact hit during the outbreak!
Wow, I knew that Doppler wasn’t around but I didn’t think that any worthy radar images were available back then that showed hook echos, etc. I figured all the warnings had to come from word of mouth of confirmed tornadoes only.
A bunch in WV look like they could have been from one single tornado that left the ground and touched down again since they are in a line. Do they normally get classified as separate tornadoes when that happens? Also interesting that cluster happened in WV which is of course almost all mountainous, and #137 stayed down for awhile over many ridges I’m sure.
-Jim
I’ve heard them described as “green blobs” on the radar.
This link shows some video of the radar: http://ww2.ohiohistory.org/etcetera/exhibits/swio/pages/content/1974_tornado.htm
You bring up an interesting point with many individual tornado tracks in the same line. That likely happened due to “cyclic supercells” meaning the same supercell produced multiple separate tornadoes. There is actually a debate regarding whether the Tri-State tornado in 1925 was actually one continuous long-track tornado (as believed for years) or actually a series of tornadoes.
James Spann shared this tornado warning which notes the radar. Quite different warnings back then.. we’ve come pretty far pretty fast. https://twitter.com/spann/status/319563330996019202/photo/1
Interestingly the centerville radar site they mention in the warning is still there but not operational any more.
Nice find on the warning Ian, although even with a warning like that the distribution to the public probably lagged enough that it didn’t help. Without the internet, text alerts, breaking news interuptions, scrolling warning on the bottom of a TV screen, etc I’m sure very little of the public heard the message. Probably only an interruption on the radio for the emergency broadcast. I am surprised there were not more than the 319 fatalities.
Good to know, Jamie!
True on the dissemination angle Jim. I’m not sure how prevalent sirens are in that area.. not that they get the msg out properly but probably still helpful at least on the margins. It is surprising the fatalities were not worse.
Jamie incredible story. I’m glad you and your family made it through alright, and thank you for the first hand account!
Before we went to the basement, we were watching it on B&W TV which is what most people had at that time. You could clearly see a hook echo in the image, very well defined.Really, from our perspective, it was more of a large white blob with a tail hanging out of the sw corner. You could also see the inflow producing the hook echo. Radar was actually fairly strong in those days compared to what wattages are used today. The conventional wisdom was also to open the windows to equalize pressure which, at the distance we were at, was actually not a bad idea even though it’s a big no-no today. I remember our ears popping several times as the pressure dropped. There are some excellent super 8 videos of the damages on facebook at https://www.facebook.com/HuntsvilleMadisonCountyRevisited?fref=ts.
Frankly, I’m convinced that there is a demarcation starting at the Mississippi/Alabama line and loosely following the difference between the growing zones between Huntsville and Birmingham. Historically, if there’s a tornado in Alabama, they are likely to be in the NW quadrant of the state. From what I understand, this area is far more likely to be the true tornado alley with more overall tornadoes than the midwest.
Jamie as a geographer I’m intrigued by your Alabama observation of the demarcation between growing zones. Believe it or not I’ve read an article that argues land cover types could influence tornadogenesis, i.e. a warm/moist (irrigated) field may provide some added instability that a cool and dense forested area would not!
….and the ears popping around tornadoes as you’ve experienced yourself is real. Happened to me around an EF4 tornado in South Dakota!
You should include this map / visualization if you haven’t seen it yet: http://www.brendansweather.com/?post=Mapping_the_Super_Outbreak_of_1974
Awesome map!! How did you make it?
Beautiful use of graphics to illustrate and illuminate. To answer a couple of points raised in comments – yes, there was some advance notice of an outbreak. The storms forecast center (then in Kansas City) had issued nearly 24 hours in advance, a somewhat cryptic notice to radar offices to be prepared. Similar advance alerts were not available to the general public. Weather radars were used as information gathering systems, not directly in the warning process. Many radar units were not co-located at warning offices, but at facilities meant as observing and reporting units. Weather offices with warning responsibility used remote facsimile presentation of radar displays, and those displays were extraordinarily poor at depicting small or subtle radar signatures. Even the principal radar display was unable to differentiate the echo into discrete reflectivity areas, plus most radar observers were untrained in detection of signatures of deadly weather.
Thanks James. Even though I have no meteorological background and do not work in the field, the notification and communication to the public–especially with tornadoes and severe weather, are important to me. (Hurricanes, winter weather, yes those watches/warnings/advisories are important but they usually have a much longer lead time to the event). Even though I live in DC, my family in the midwest where tornadoes are frequent span all sides of how to react. They include those that ignore all tornado warnings to others that hide in the basement as soon as a severe T-storm watch is issued. I feel like I constantly have to remind them when to take action, when to be on the lookout, and when to just be prepared but not disrupt your daily activities. I like the use of “potential” instead of watch and “is approaching” instead of warning. Those are better than watch and warning which start with the same two letters and are ofter interchangeably the same meaning to the public. However, I do not agree with trying to scare the public with the potential language being tried now in the pilot study I saw recently. A few false alarms or misses when dire threatening language is used can really cause the public to ignore warnings in the future.
By the way, I can only imagine what the public did or did not do during that outbreak for the few that did get the NWS alert. Glad we’ve gotten better at the technology but there is still a long way to go with how to communicate it. (I’m an engineer and also frequently fail when trying to communicate technial information to a broad audience).
Thanks James! And thank you for the excellent explanations and information regarding the warning lead time of that event. I’ve heard a story where a forecaster at Wilmington recognized the atmospheric set-up as similar to one that caused a smaller tornado outbreak years before and used that prior knowledge to stress the possible severity of the upcoming event!
You might also find it interesting to see some of the work we have done in the insurance industry to study this event. Several years ago I digitized the Fujita maps and ran loss models to quantify insurance loss if the event were to reoccur. The study can be found here:
https://ams.confex.com/ams/11aram22sls/techprogram/paper_81713.htm
The headline from the study:
…a repeat of the 1974 Super Outbreak today would cause a record level of economic and insurance losses. The insurance losses from wind alone (tornadoes and downbursts) would exceed $3.5 billion, surpassing the $3.13 billion in insurance loss (PCS July 28, 2003) reported for the May 2-11, 2003 sequence of tornadoes that impacted 18 states. Approximately 2/3 of this loss would be to single family residential property, with commercial and industrial properties being the second largest contributor. Kentucky would incur 28% of the total loss, with 26% and 21% coming from Indiana and Ohio, respectively.
Kyle that is fascinating stuff! Thanks so much for sharing. Have you been involved in any similar studies like this one?
Wow, I knew my county was hit by 3 tornadoes during the 74 outbreak but I had NO idea they were all F3. That is simply amazing. Really great how you break your articles down in conjunction with the maps. It really helps tell the whole story. I just discovered this site and have literally been on here 2 hours reading all the articles.
Thanks Michael! Happy to have you read all the articles!
Great work Kathryn, It was my 8th birthday in 1974 when the F5 Tornado hit the western edge of Cincinnati. The civil defense sirens saved a lot of lives here, even though that was the first time I heard them go off for a weather event.
I had family that lived on a farm S/W of Xenia. The had no warning except for watching the sky.
Any way thank you for your work.
Michael
was living on trinity mountain (trinity,alabama) at the time and remember that day very well, could look down the mountain toward decatur, but could not look the other way over the mountain, was a very scary night, i was 13 years old at the time
I was four years old in Decatur Illinois when this outbreak occurred the one that hit Decatur came from the Macon county fair grounds crossed mound road jumped over our house and hit the neighborhood a few blocks behind us my brother mom and myself were on our way to meet up with my dad who was on a business trip in Bloomington Illinois when the tornado hit thankfully no one in my neighborhood was killed by this tornado we were by Parsons elementary school when we seen the twister it looked to be like an f-1 to F-2 my dad worked for the great american insurance company at the time it destroyed half the neighborhood behind us the worst hit was shadow lane and mound roads it was pretty Scarry my dad had to photograph the damage zone since he insured most of the neighborhood while he did his job me and my dad gotten separated and I gotten lost since I could not recognized the neighborhood from all the damage if it was not for one of our friends we knew who found me and took me to a friends house my dad would have been really panicked but it thought me to stay real close to my pops whenever we went out photographing I reflect a lot on April 3-4th of 74 and Count my blessings every day
I am a survivor of the Xenia, Ohio tornado of 1974. I was 9 years old. I will never forget my experience and all that I saw that day. In a matter of ten minutes, my whole life changed forever. I hope to God that I will never have to go through that horror again. Even at 50 years of age, I still get jittery when the skies get dark during a strong storms. I was a scared, frightened and helpless child who was comforted by wonderful and awesome caretakers (the Red Cross) until they were able to locate my parents. I was staying with a friend of my mother when the tornado hit. She gave her life to save mine. She will always be remembered as a hero! God bless her!
I was there less then a mile from Futon county/ Rochester Indiana. just north of the Dairy Farm in Rochester. Twins come down from no were, hit the ground turned an ugly gray passed my father sister and mother then disappeared, but not before a side by side ground to ground raindow.Cows everywhere many lost their Iives. f4. I still have all the new clips and pics
Holy crap, I live in Tennesee, that looked horrifying. I’m glad I didn’t live then.
Other than that, it was a literary beauty
Marvelous, what a weblog it is! This weblog gives
useful facts to us, keep it up.
It’s actually a cool and helpful piece of info. I am satisfied that you just shared this
useful information with us. Please stay us informed like this.
Thank you for sharing.
May I simply ssay what a comfort to find somebody whoo really
understands what they’re talking about over
thhe internet. You certainly know howw to bring a problem tto light
and makee it important. More and morre people should look
at this and understand this side of the story. I was surprised that you’re not more popular
because yoou certainly have the gift.