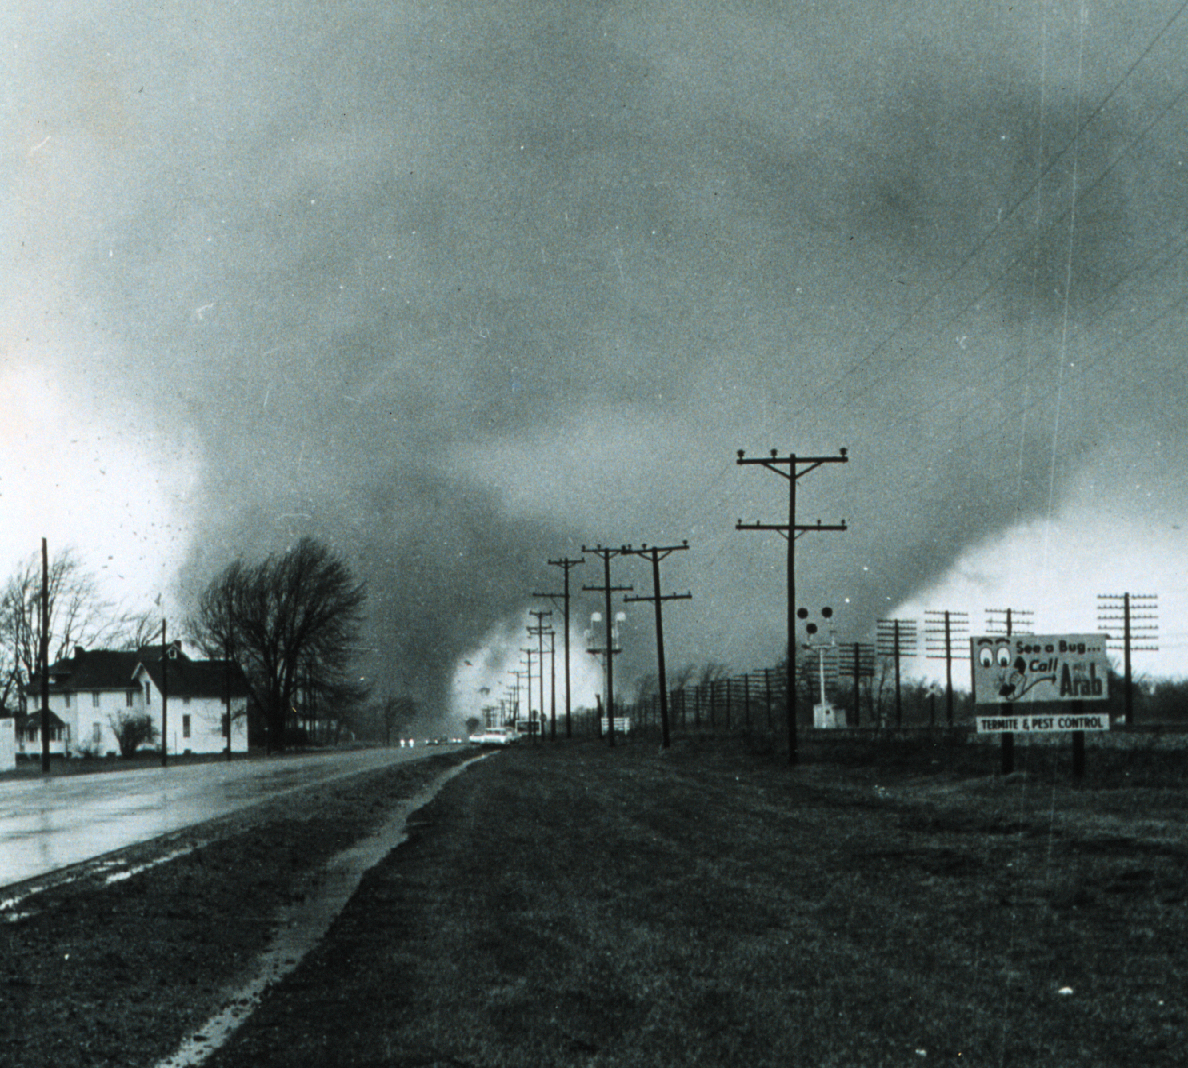
On April 11, 1965, and over a time span of approximately 12 hours, one of the most infamous tornado events in United States history took place across the Southern Great Lakes region. Commonly known as the Palm Sunday Tornado Outbreak (more precisely, the second Palm Sunday Tornado Outbreak, following one in 1920 and preceding another in 1994), numerous fast-moving tornadoes were unleashed upon the states of Iowa, Illinois, Wisconsin, Indiana, Michigan, and Ohio.
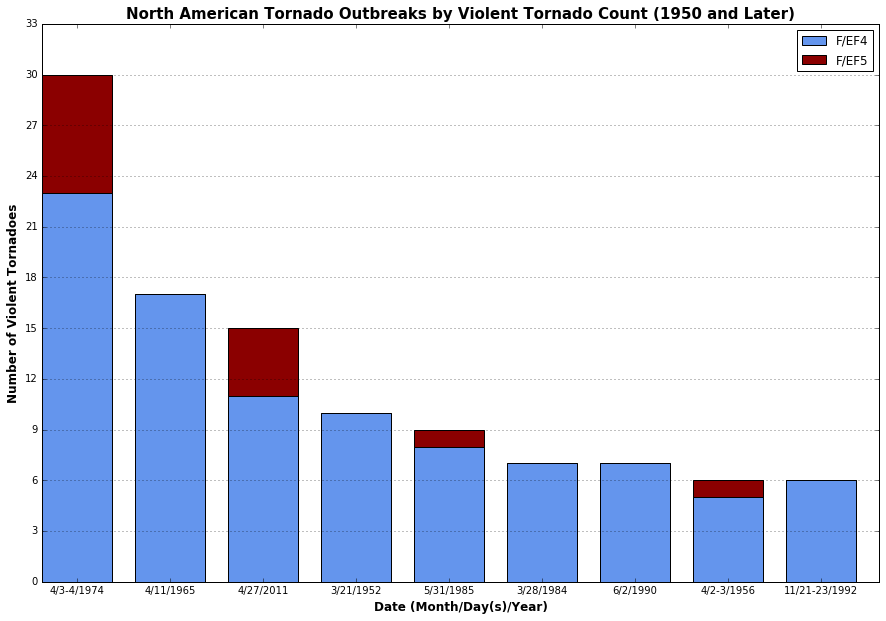
The twisters claimed over 260 lives, injuring thousands of others and causing hundreds of millions of dollars in damages. It was the worst tornado outbreak in Indiana’s history with nearly 140 killed in the state alone. In modern tornado history, this ranks second to the Super Outbreak of April 3-4, 1974 in terms of violent tornado count in a single North American outbreak, with 17 F4+ tornadoes.
The meteorological setup in the days prior to the tornado outbreak was extremely anomalous. In the middle and upper levels, an exceptionally large, positively-tilted trough was anchored across much of the western half of the United States, sending multiple vorticity maxima out into the Plains. The system had already shown its teeth the day prior, where several tornadoes passed north of Kansas City, and a violent tornado struck Conway, Arkansas. The latter claimed 6 lives.
The strongest impulse within the broad-scale trough eventually progressed to south of the Four Corners at 12z (7 AM CDT) April 11 and brought with it an exceedingly strong, west-southwesterly jet streak of 135 to nearly 145 knots at 500 mb by 00z (7 PM CDT) April 12 as it ejected east-northeast over the Midwest.
To put that in perspective, the record-breaking tornado outbreak of April 27, 2011 across the Southeast had a jet streak of around 110 to 115 knots at 500 mb at its peak. Jet maxes like this are rather rare in winter storms, let alone punching into the warm sector of a severe weather outbreak.
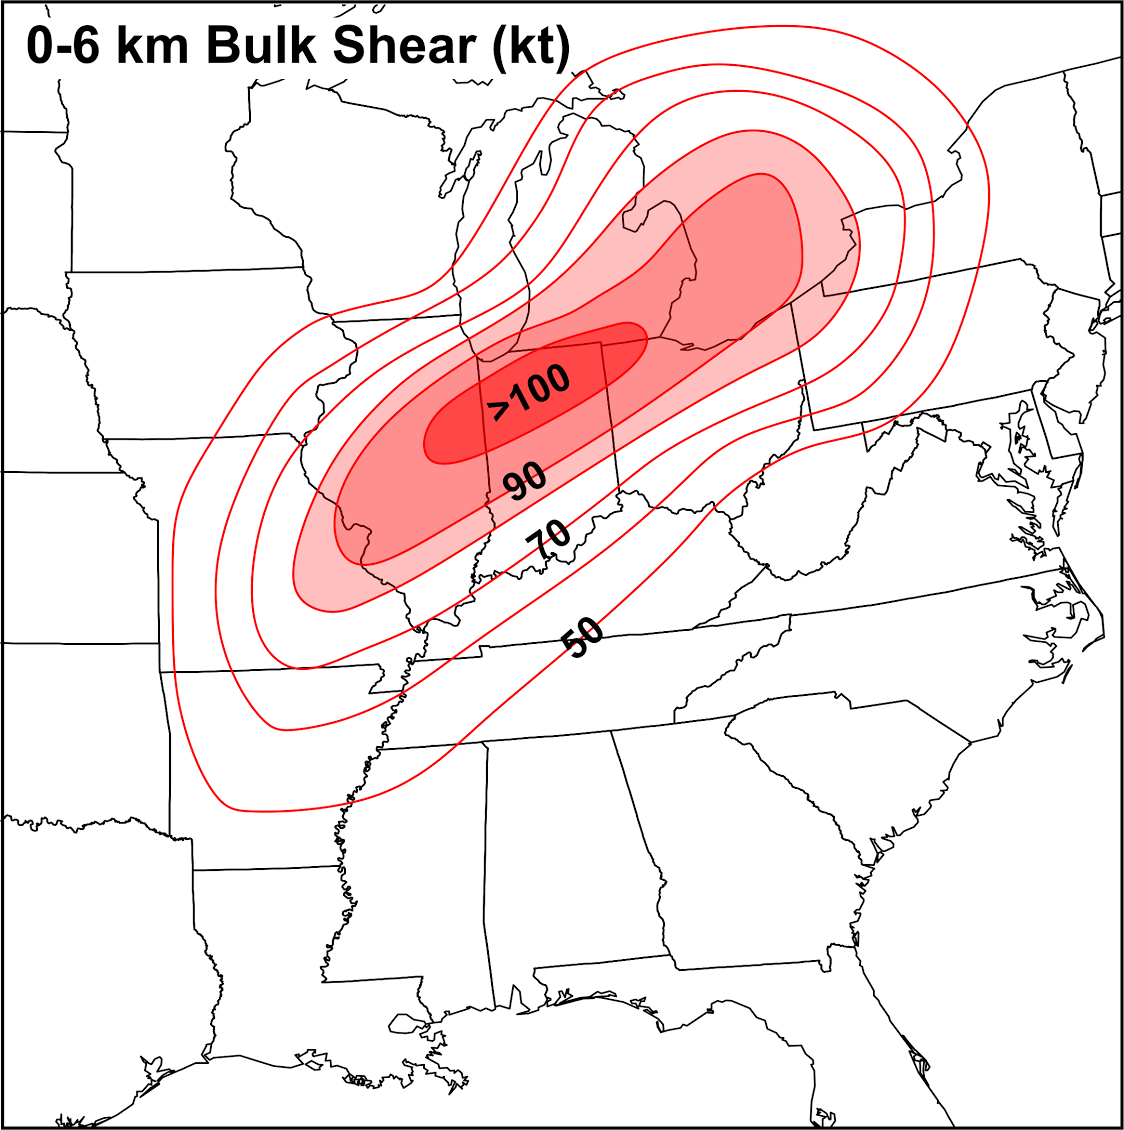
These extreme winds aloft, along with southerly winds near the surface and strong southwesterly/west-southwesterly flow at 850 and 700 mb, resulted in exceptional values of deep layer shear. 0-6 km bulk shear in the primary outbreak zone regularly exceeded 45 ms-1 (87 knots). The aforementioned southerly near-surface flow also led to the transport of a warm and relatively humid air mass into the Great Lakes region.
Upper 50s dewpoints were present over Michigan, increasing to middle 60s further south into central Indiana and Ohio. This, along with temperatures rising into the low-and-mid 70s, plus a plume of steeper mid-level lapse rates moving in from the Plains and the Desert Southwest, provided the instability necessary for severe thunderstorm development. The abundant shear suggested vigorously rotating storms were highly likely once this took place.

As a strong low pressure center moved out of the Central Plains through the day (ending up in Wisconsin by 00z 4/12), its associated cold front and even a dryline-like feature swept eastward and provided the trigger for severe storms. Storms stayed mainly discrete due to the presence of a healthy elevated mixed layer over the region.
Driven by the aforementioned wind fields aloft, the storms rapidly intensified into supercells, raced to the east-northeast at 55 to 70 mph and began producing significant tornadoes. The first violent tornado of the day tore a path across eastern Iowa early in the afternoon, killing one person. This was followed about two and a half hours later by another F4, which struck the northwestern Chicago suburb of Crystal Lake and killed 6 more.
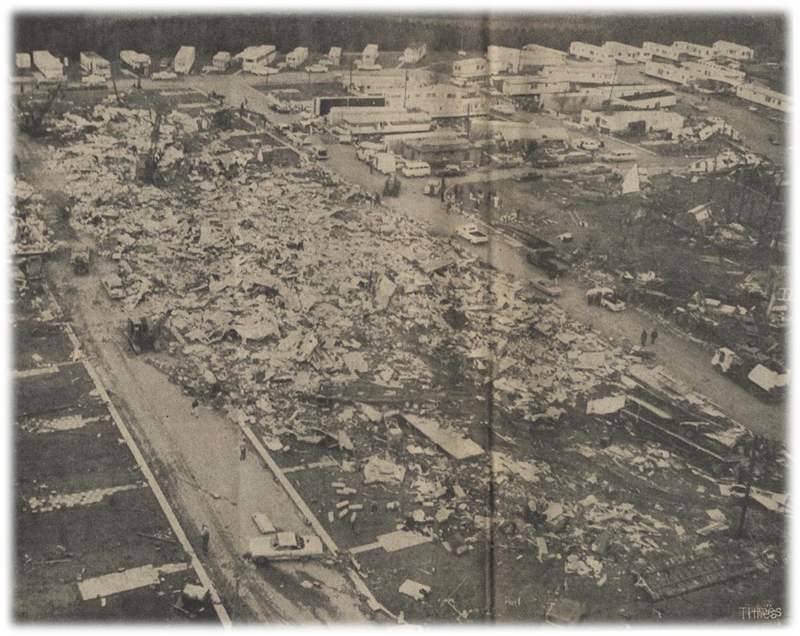
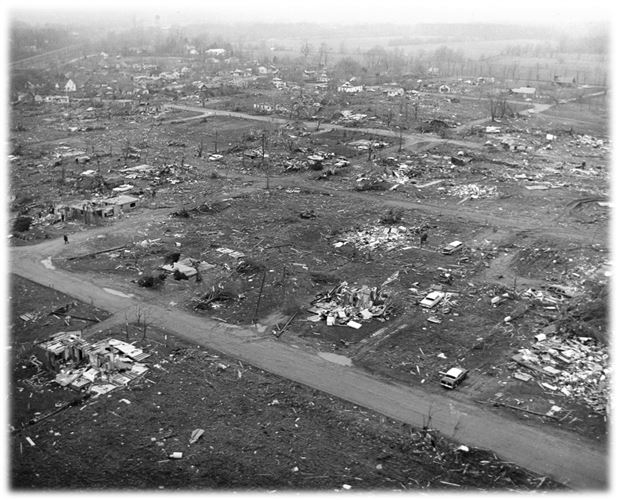
Long-tracked tornadic supercells then continued well into the evening, with the hardest hit locations including a swath through northern Indiana to the south and east of South Bend, where dozens were killed. At least 50 of these fatalities occurred in and around the community of Dunlap from two tornadoes. The first blasted the Midway Trailer Park along Highway 33, leading to 14 deaths, while the latter rampaged through the Sunnyside and Kingston Heights subdivisions further to the north, becoming the deadliest single tornado of the outbreak with 36 perishing. This corridor also extended into southeastern Lower Michigan, as two powerful supercells spawned a series of intense tornadoes.
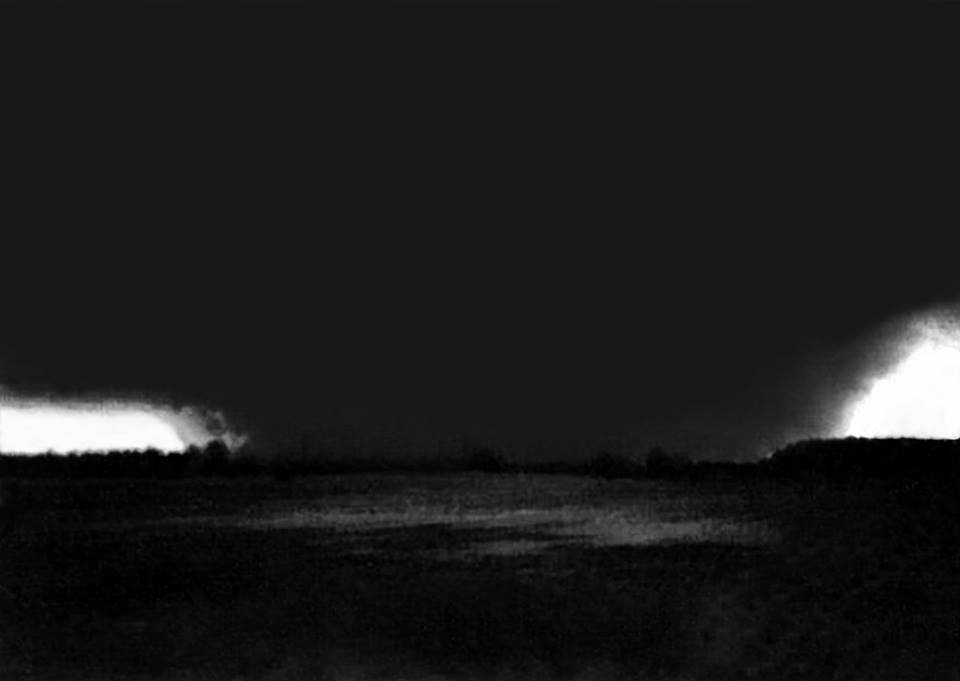
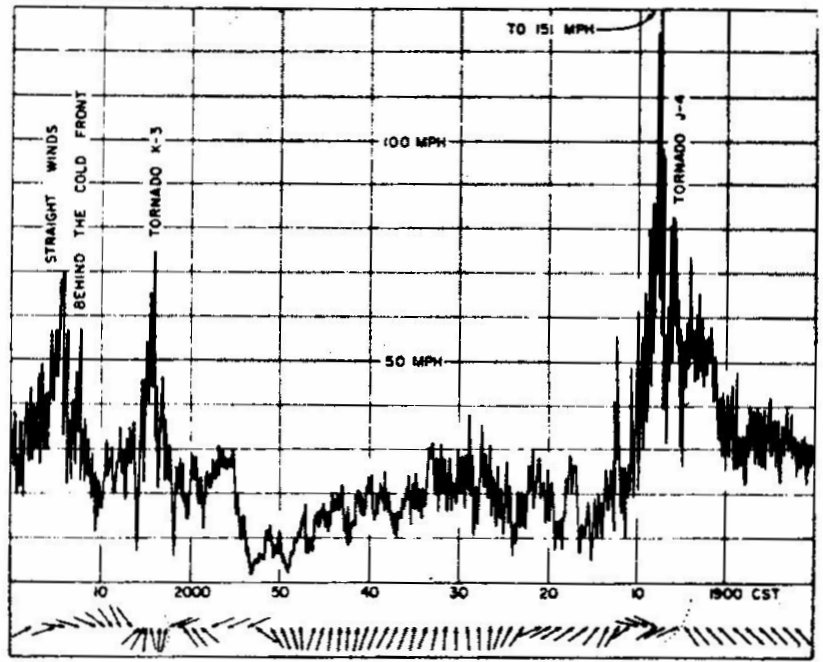
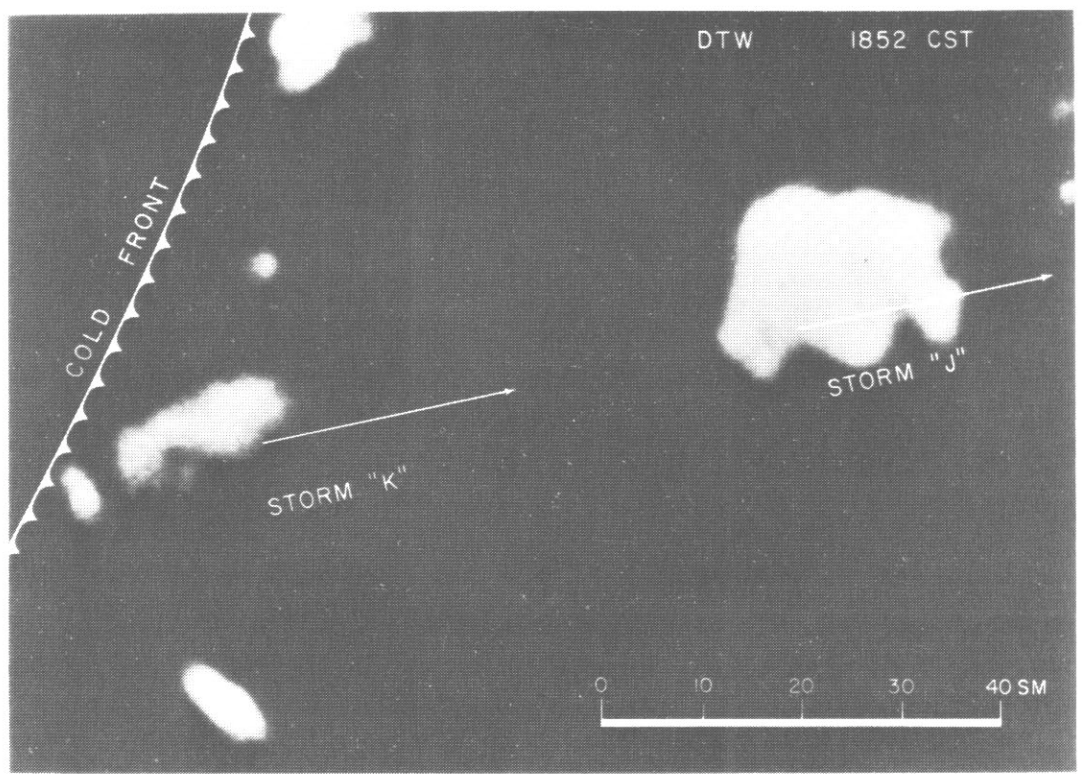
A wind gust of 151 mph was recorded near Tecumseh, Michigan by an anemometer as the first in a pair of F4 tornadoes to follow nearly the same track passed near the Mayers Airport. A secondary spike in wind velocity was also observed with the second tornado’s passage. These two tornadoes alone killed 44 people and injured over 600. In some cases, buildings left unscathed, or partially damaged by the initial tornado, were destroyed by the second one. The WSR-57 radar near Detroit also captured the pair of tornadic supercells as they followed one another as if part of a railroad.
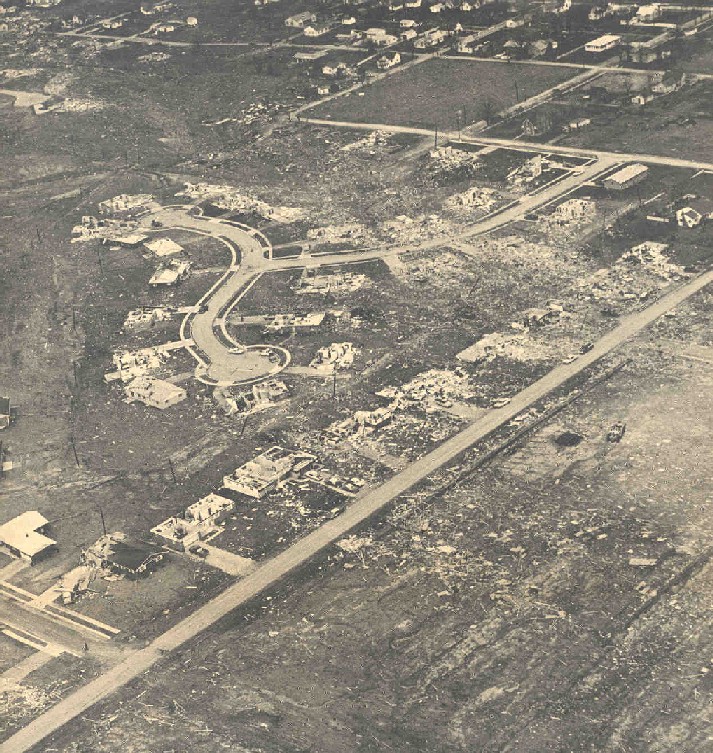
Further to the south, two F4 tornadoes claimed a total of 53 lives in central Indiana. One cut a path through Russiaville and Alto, as well as the south side of Kokomo and Greentown. It destroyed hundreds of homes in the process and injured over 800 people. The other devastated the vicinity around Crawfordsville and Arcadia, with the towns of Lebanon and Sheridan particularly hard hit.
Violent tornadoes also struck the Grand Rapids, Michigan and Toledo, Ohio metropolitan areas in addition to the Lima and Strongsville, Ohio areas. By the time it all wound down, at least 40 tornadoes had sped across the Great Lakes region, leaving trails of devastation over a coverage area roughly 450 miles long and 450 miles wide.
At one point during the height of the outbreak, bewildered by the amount of tornado reports coming into the office, the National Weather Service office — then the U.S. Weather Bureau — responsible for Northern Indiana placed all nine counties under its jurisdiction under tornado warnings. Known as a “blanket tornado warning”, this was the first and only instance of such occurring in the history of the National Weather Service.
The combination of the outbreak occurring on the holiday of Palm Sunday, the lack of awareness of the tornado watches (then called tornado “forecasts”), and the widespread communication problems as the storms cut areas off from electricity undoubtedly amplified the casualty totals. The tornado forecasts were exceedingly well placed for the time, as nearly all of the major tornado reports in the Great Lakes region fell within the borders of at least one of them. People simply had no idea the storms were occurring, as they were either preoccupied, unable to receive warnings or both.
The events of April 11, 1965 ended up becoming the primary catalyst in the development of the tornado watch and warning program that is still in use today, whose necessity was highlighted in the Weather Bureau’s service report in the wake of the outbreak. In addition, extensive analysis of the outbreak was done by Dr. Ted Fujita, leading to the discovery of features such as suction vortices within tornadoes, which can locally amplify damage significantly. The Monthly Weather Review paper written by Fujita and Dorothy Bradbury is a must read for all interested in severe weather meteorology and tornado history. It includes photos of the helical patterns within the tornado damage paths that lead to the suction vortex conclusion.
Despite the tragedy of the Palm Sunday Tornado Outbreak, it was a crucial building block and learning experience in the infancy of the ever-advancing tornado detection and watch/warning systems. Nine years later, even more significant advances would occur following the Super Outbreak, with the development of Doppler radar and expanding satellite presence.
So, as we look back half a century at one of the most notorious tornado events in the United States, it remains to be seen what will happen when something like this occurs once again in the Great Lakes region, as advances in technology are challenged by population growth and urban sprawl. We’ve recently witnessed the unbelievable on April 27, 2011 and in the Joplin, Missouri tornado on May 22, 2011. Large death tolls are not unavoidable in this day and age, but hopefully they will not rear their ugly heads like they did on Palm Sunday anytime soon.
Sources/Other Recommended Material:
Plymouth State Reanalysis: http://vortex.plymouth.edu/upcalc-r.html
ESRL (CIRES) 20th Century Reanalysis (Sub-Daily Composites): http://www.esrl.noaa.gov/psd/data/composites/subdaily_20thc/
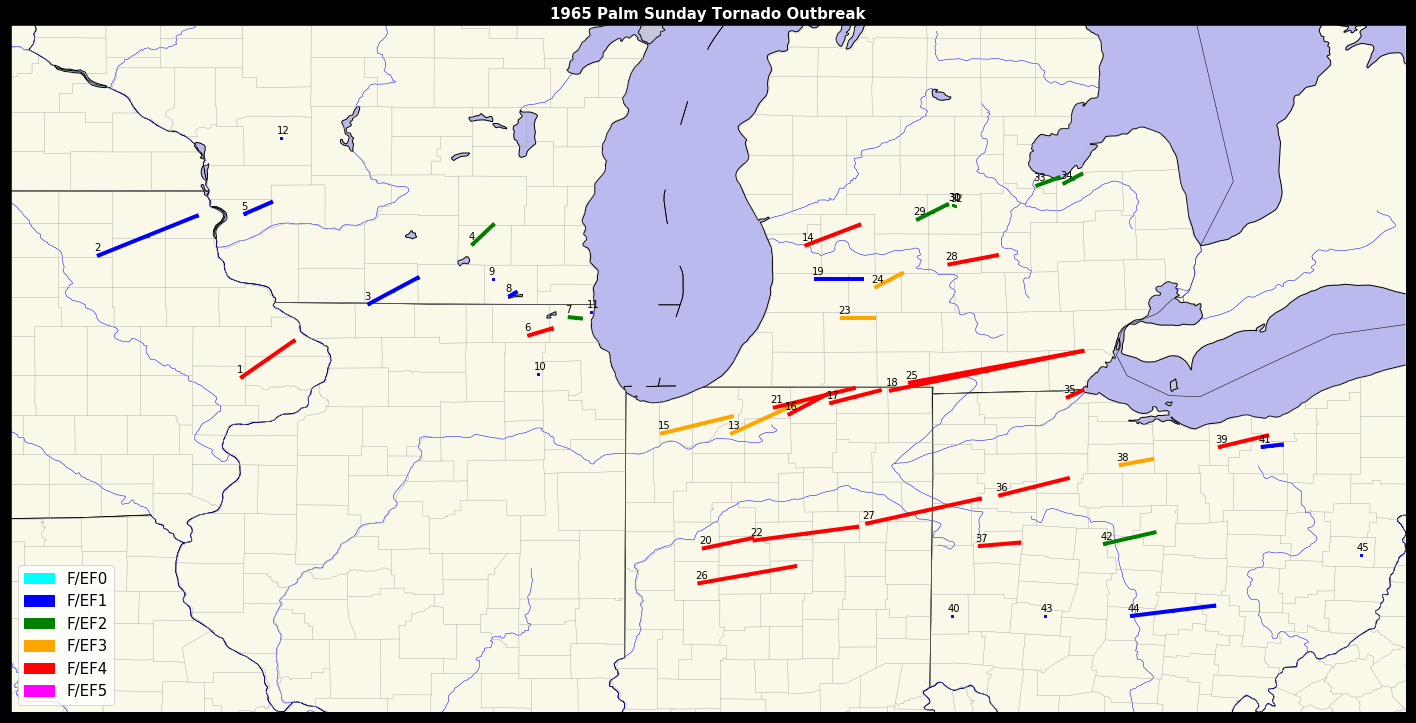
Tornado History Project Outbreak Map: http://www.tornadohistoryproject.com/outbreaks/the-palm-sunday-outbreak-1965/map
NWS Detroit/Pontiac, Michigan Outbreak Page: http://www.weather.gov/dtx/palmsunday
NWS Indianapolis, Indiana Outbreak Page: http://www.weather.gov/ind/palmsuntor
NWS Northern Indiana Outbreak Page: http://www.weather.gov/iwx/1965_palmsunday_50
Stormstalker WordPress Outbreak Article: https://stormstalker.wordpress.com/2013/01/05/1965-palm-sunday/
The Elkhart Truth Article: http://www.elkharttruth.com/living/Community-Blogs/Elkhart-County-History/2014/04/11/This-Day-In-History-The-Palm-Sunday-Tornadoes.html
Jon Chamberlain’s (NWS Rapid City) 2015 Reanalysis: http://www.weather.gov/media/crh/publications/TA/TA_1502.pdf
Fascinating write-up.
I just wanted to point out that the F-scale values for the tornadoes are wrong (at least some – I didn’t have time to check them all). They seem to be one level lower than their actual value. For example, the long-track tornado through Green, Dane, and Jefferson Counties was an F2, and the F2 shown crossing interstate highway 94 was actually an F3 (near F4). This is according to Storm Data and Grazulis-Significant Tornadoes.
My sister and her future husband survived the F3 tornado in a car on I-94. They were unable to open the doors so they huddled on the floor of the car as the windows shattered. The tornado killed 3…all in vehicles. It was the only killer tornado in WI that day.
You’re referring to the map? I just checked it against SPC data and theirs matches up. Grazulis ratings are not official and don’t match the record in a lot of cases, though there is plenty of debate on a number of older tornadoes.
Yeah, that’s the problem. Grazulis differs on several of the tornadoes, especially those in Wisconsin and the Dunlap, IN and Strongsville, OH F4/F5s. I tracked down damage photos from several of them and Grazulis’ ratings are clearly more appropriate, but ultimately they aren’t official and the official ratings are unlikely to change.
Interesting, I did not realize that Grazulis ratings often differ from SPC data. In my experience (and I’m thinking most specifically the 1950s) the SPC data ratings appear to be inaccurate, but seem to be biased too high. There seem to be too many F1s and few to no F0s. In addition, some of the “official” tornadoes appear to have actually not happened. In researching these tornadoes via local newspapers, I’ve more than once encountered newspaper reports that clearly state that there were funnel clouds only, with no touchdowns. These events are listed by SPC data as F1 tornados.
That brings me to a question…how were the “official” lists compiled? Today, local NWS offices do extensive surveys, and appear to be complete and assign, as accurately as possible, EF ratings. I tend to take them as gospel, or as close as gospel as one can get. However, the further back in time, the more and more inaccurate the reports seem to become.
Another question I have (and I don’t expect you to be able to answer) regards the Wisconsin State Climatologists database, which goes back to 1844. There’ve been multiple state climatologists since the database was compiled, so the climatologist doesn’t have the answer. There are multiple events I can’t find info about, and others that are simply wrong or didn’t happen.
Thanks!
Tim
The official record is very much imperfect, which is probably to be expected since the F-scale didn’t exist until 1973 and there wasn’t much in the way of organized efforts to collect and catalog tornado data outside of Fujita’s superb efforts. Many pre-1970s tornadoes were actually rated by Fujita’s grad students, piecing together information from newspapers and whatever other sources were at hand. As you said, some tornadoes are recorded that likely didn’t actually occur, others that did occur are missing, ratings are often questionable and path information is often wildly inaccurate.
Grazulis’ data is much more complete and thorough, though still not infallible. The SPC database is more convenient simply because it exists as a database and can be mapped, sorted, analyzed, etc., but wherever possible I prefer to use Grazulis. In any event, there really is no perfect solution. I’ve found that the more you research tornadoes, the more you discover that the majority of available official information is rather inadequate, to put it kindly. Tornadoes don’t lend themselves particularly well to quantification and categorization to begin with, but it’s much worse when you’re dealing with tornadoes that happened decades ago and for which very little information was gathered at the time or survives today.
It’s frustrating, but it’s also fun to play detective in tracking down all sorts of disparate information in search of clues.
Thanks for the response. It’s interesting to hear your take on the pros and cons of the NWS database versus Grazulis. Throw in the state climatologist database and another Wisconsin database and you’ve got a real mess! I do wish I knew what the sources are for some of the early storms. I’ve been researching historic tornadoes in Wisconsin for over 20 years and I’ve got as many mysteries now as I did back then. It’s frustrating sometimes having the result of scouring old papers end up being a “possible” tornado…not enough information to confirm it, but too much information to dismiss it as well. It sounds like I’m not the only one who has discovered this problem.
Yep, that’s a common problem for me as well. I’m actually struggling with exactly that right now. I’m working on an article on the 4/5-6/1936 Tupelo – Gainesville outbreak, and I found information via newspapers and first-hand accounts that seems to suggest at least two new tornadoes that have never been officially recorded, but I just don’t have quite enough info to confirm it confidently. I’m pretty sure they took place and I have a solid idea of what the path looked like and a rough intensity estimate, but it’s not rock-solid. Similarly, I’ve done research that leads me to believe the Red Bay, AL tornado may actually have been continuous with the Tupelo, MS F5 (officially separate), which would greatly extend the path length of the Tupelo F5. It’s pretty solid, but again I’m lacking the smoking gun, as it were, to confirm it 100%.
It’s work that’s fun and challenging, but it sure does get frustrating after you’ve worked for so long only to discover you’ve raised more questions than you’ve answered. That’s sort of how it seems to go most of the time.
Thanks for letting me know how storms arrived at their Fujita rating pre-1973. I didn’t realize it was grad students and not based on any sort of actual survey.
Yes those are all good points. My introduction to the tornado database was through the green book.. I still have it for reference but it’s hard to turn away from the official record and the sortability of using a computer!
The record is very junky, especially before full nexrad implementation plus the huge increase in chasing/spotting. There’s still some use when you zoom out a bit.. and the data is getting better with time. Future generations of us should have it fairly good.
I would love to have Grazulis’ green book converted into a database similar to SPC. It’d be a gargantuan, mind-numbingly tedious task, but the end result would make things so much easier. We all know Grazulis’ work is (mostly) superior, but most are hesitant to use it simply because it’s stuck in a book and it’s so clunky. My only contribution to this point has been creating more accurate maps for various significant events, but even that is time-consuming and tedious. It’s shocking how awful some of the SPC tracks are, since they’re basically just working with start and end points.
One other project that I’ve longed to do, but probably will never have the free time, motivation and/or money, is to create an online database (TorWiki?) of significant tornadoes (possibly starting with all E/F5 and expanding to E/F4 to begin with), featuring information and stories about each, an accurate map, photos and video where available, as well as, whenever possible, location markers on the map for where each photo/video was taken. I’m probably one of very few people who’d even be interested in such a thing, but I find myself daydreaming about that sort of thing occasionally.
Great stuff, Andy. There are so many things about this outbreak that are truly exceptional, but the kinematics in play on that day just blow me away. Genuinely a case of “winter dynamics with a mid-spring warm sector” if ever there was one.
Cheers Shawn, yeah this outbreak featured the strongest 500 mb jet streak I’ve seen with a severe weather event (at least going by events that also had appreciable buoyancy to work with).
It must’ve been an awesome jet streak. In Detroit at about 6:00PM ET there was no wind at the surface. Totally calm. But look up, and Yikes! clouds with weird flat dark gray bottoms (10,000 – 15,000 ft up) were racing east northeastward like at probably 70 miles per hour; the clouds themselves not even distorted by the wind. It looked bizarre. It reminded me of a home movie being played with the projector sped up to the max. I recall my dad (who never worried about anything) looking up at that sky and saying “I don’t like the looks of this.” It would be another hour or so before we were actually aware of what was going on to our southwest.
The tornado that hit Russiaville near Kokomo, Indiana was actually clearly an F5. I agree with Grazulis. I saw the damage on TV right after the event. Buildings of all types were swept completely away, leaving nothing behind. I think there was some of that in the Crystal Lake tornado as well. The Grazulis book shows that. In addition, people hovering in full depth basements in Crystal Lake, IL were pulled out with the contents and killed.
In Crystal Lake, the three members of the Holter family who died in their basement weren’t pulled out. They were doing what they were supposed to do during a tornado, in their basement, and sheltering under a heavy table. They died when a truck landed on the table. There is a photo showing the ’59 Chevy pickup truck in the basement.
Tornadoes pre-Fujita era were rated based on photos and in some cases, just worded reports. Grazulis provides a wealth of both, but obviously, engineering studies are required to establish exact ratings. Doable, but very time consuming.
This outbreak has to be a one in a 100 year thing, but definitely resembles the 1920 outbreak in time and place. Both had a very long track “mother tornadoes” nearer the southern extent of the outbreak – this outbreak had 2 or 3. The 1920 outbreak’s “mother tornado” went from around Fort Wayne, to Sylvania, OH, ending near Kingsville ON, across Lake Erie.
I do remember from my front porch in Detroit, about 6 PM EST, the clouds at about 10,000 ft moving ENE faster than I’ve ever seen, before or since, despite surface winds being southerly and less than 10 mph. It was downright eerie, and scary looking, even before we realized there was a tornado “forecast” for us, and hours before the storms got to us.