Back in 2013 in the early days of US Tornadoes, contributor Kathryn Prociv created a guide to understanding basic radar signatures for tornadoes. And in the four years since that article, researchers and technicians have been busy identifying new ways of picking out tornadic signatures from their radar scopes. Simply, new technologies came to the system that helped in the pursuit.
Given the advancement of radar technology, it seems worth diving deeper and get into the nitty gritty of identifying tornadoes from radar signatures. The images in this post are the same as those seen by forecasters sitting at the warning desk(s) at the National Weather Service. The post is probably technical for those with limited radar watching history, but many of the signatures are easy to understand even with no prior background.
So let’s jump in!
New toys
The most useful weapon in this battle of storm vs. electromagnetic waves has come by upgrade to the radar itself.
The most significant upgrade is called Dual-Polarization. It’s been in the works via the good folks at the National Severe Storms Lab since the early 2000s. In 2011-2013, the technology was deployed to all the NEXRAD / WSR-88D radars around the world. The technology is also in use by some private organizations, such as TV stations and academic research groups. What the dual-polarization upgrade adds to the radar is an extra vertical pulse of radiation along with its normal horizontal radiation pulse. This provides a cross-section of every target the radar pulses bounce off of.
Radar watching Basic tornadic signatures | Advanced tornadic signatures :: Forecast basics Identifying and understanding ingredients | Search for boundaries and gradients | Looking for what could go wrong :: Spotting basics Tornado shapes and sizes
You may say this is all well and good, but what does it do for me and meteorologists issuing life-saving commands such as “take cover!”?
The answer is primarily focused on two objectives. 1) How sure we are about the tornado doing damage and 2) How sure we are about the strength of the tornado.
1. Is the tornado occurring?
There are two primary ways that we can tell if a tornado is occurring. The first is if someone tells you that it’s happening. Storm spotters and chasers have many ways to directly call or inform the National Weather Service about an oncoming tornado. If seen by trained eyes, this is the most reliable and quickest method to get the information to the right people in the shortest amount of time. However, there are many times in which a spotter cannot tell if there is a tornado there or not. Difficulties for tornado observation include nighttime, a tornado is hidden in rain, or a funnel which itself is transparent.
But we can also see tornadoes using radar. Radar can discern danger in the darkest night, or in a blinding rain. It can pick up on subtleties that the human eye can not always detect.
A radar needs to display two pieces of information to indicate that a tornado is present.
1A. Enough rotation in the storm to produce a tornado.
1B. It detects debris in the air that is not of atmospheric origin near the area of rotation.
In regards to 1A, it really depends on the storm and the environment the storm exists in. Tornadoes, and especially their formation, can be finicky processes. One measure that meteorologists use to judge rotation is a parameter called Rotational Velocity, or Vrot for short. Vrot is a simple equation that takes the maximum outbound velocity (red) and the maximum inbound velocity (green), adds them together, then divides that sum by two. Vrot can be measured at any height in the storm, but despite all the capabilities that radars have, they are still limited by physics and geography. Either one of these things can hamper efforts to identify and characterize Vrot strength. For sake of argument, lets assume that we are looking at around a mile or two up into the heart of the mesocyclone. From this vantage point, most radars in the tornadic regions of the United States can see at this height. In the graph below we see the strength that a Vrot of a certain value can be linked with a tornado.
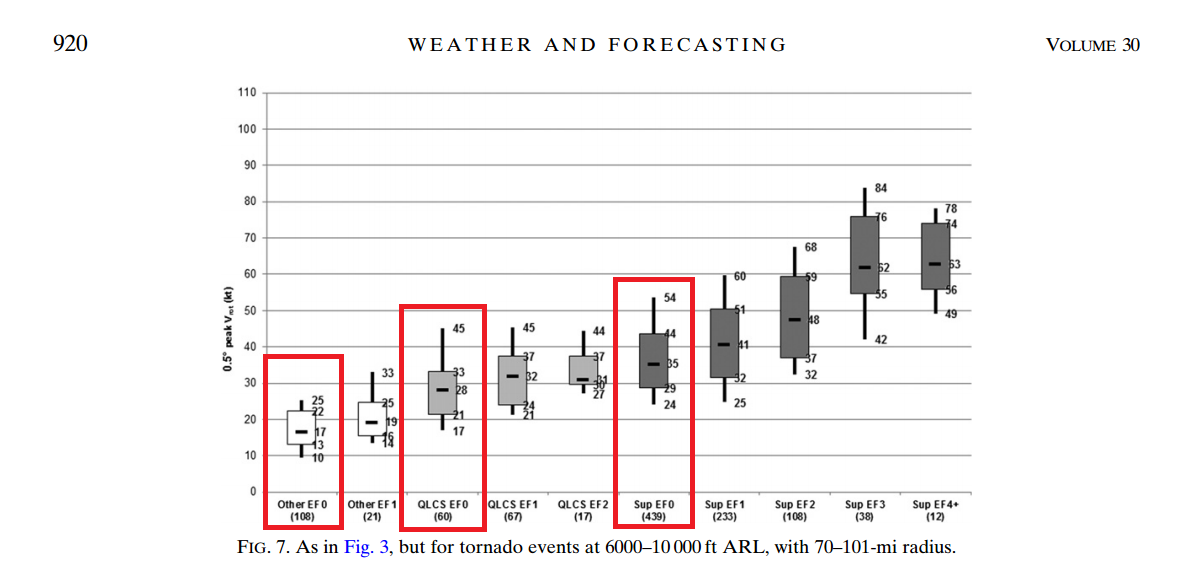
Looking at the graph, we can see that as Vrot increases, the higher the likelihood that a stronger tornado will occur with it. I want to specifically point out something more subtle here, which I have highlighted in the red boxes. This is that it only takes between 10-25 knots of Vrot to produce a tornado. This is NOT to say that all mesocyclones with this kind of rotation are accompanied with a tornado. To confirm, you must see evidence that a tornado is doing damage, which brings us to 1B.
1B is the actual detection of the things that are thrown into the air by the tornado. Non atmospheric things. A product generated by all dual-polarization radars is called correlation coefficient (CC). Correlation coefficient is the difference in a cross section between two or more pulses in the same pixel (bin). The higher the value of CC the more identical the cross-sections. Two perfectly identical cross section pulses is equal to 1, while two pulses that have nothing in common is 0.
How this relates to a tornado tearing through a grove of trees or through a neighborhood is that if a radar sees a roof shingle and a tree branch, it will look at these two objects, compare them by the amount of energy that bounces off them. When the radar sees that the things that it is seeing are dissimilar, it assigns it a lower correlation coefficient value. When this signature is coupled with a velocity couplet, then there can be good confidence that winds are whipping up debris, and thus a tornado. An additional confirmation is near zero ZDR. Below you can see a correlation coefficient map of the 2016 Dodge City tornado(es) taken by the Center for Severe Weather Research (CSWR) Doppler on Wheels (DOW) radar at very close range.
DOW7 CC from 24 May 2016 at Dodge City. Has there ever been a more textbook tornado debris signature? Fortunately missed dense population. pic.twitter.com/qUuImaQlHm
— Trevor White (@wx_trev) February 23, 2017
If you look in the hook of the supercell (bottom left) you can see a circle of blue amidst a bunch of reds and oranges. This area of the blue is the radar picking up an area of very low correlation coefficient. This is commonly referred to as a tornado debris signature (TDS). In the case of the image above, it is most likely dust, crop debris, perhaps a fence post or two and unfortunately at times other structures. Whatever it might be, it is very different from the rain and hail that surrounds it.
If it could be framed… It’s about the most perfect you could ever find a tornado debris signature.
In looking at radar data from NWS’s fixed WSR-88D radar, things are often not so clear cut.
Below is an example from 2015 in North Dakota with an EF-2 Tornado. In the reflectivity (red’s and oranges) and correlation coefficient (Note the color table is reversed from the Dodge City example, Red = lower correlation coefficient), it is not so clear where the tornado debris signature is.
However, when we see the velocity image, we can see that in the same area there is a small circle of red/black denoting in this instance a very low correlation coefficient. If it helps, you can put your mouse cursor over the velocity couplet and see how the three images match up. This is a case in which is marginally difficult to pick out. You will find in practice that some are easier than this, and some are harder
2. How strong is it?
I will caveat this section by saying that this area of research is in it’s very fundamental stage and the solutions you see below will be only estimations at best. However, the science has progressed in the past half-decade, much thanks to the dual-pol upgrades. First lets start with the informative graphic below.
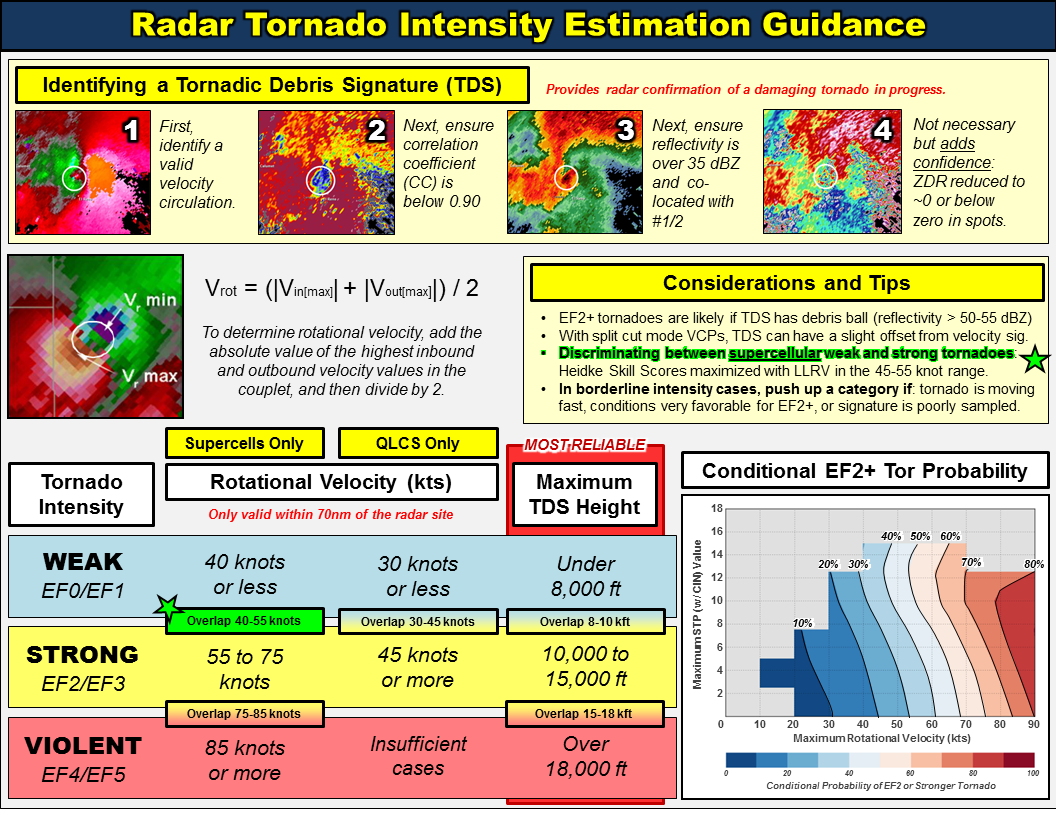
This graphic was put together by Alex Lamers (@AlexJLamers)/(http://www.alexlamers.com/) as a desktop reference guide. It does very well at breaking down all the essentials for estimating / ball-parking tornado strength. The top half of the graphic we already covered in section 1. So, let’s look at the bottom half.
In the bottom half we can see we can estimate tornado strength near-real time by looking at a few variables. First, we can use Vrot, which we talked about earlier, to approximate what category [weak (0-1) vs. strong (2-3) vs. violent (4-5)] of tornado we are dealing with. If we take the example from the Mayville storm, the Vrot was 75 knots at 800 ft. This places it in the “strong” EF-2 to EF-3 range. As mentioned earlier, it was later rated an EF2.
An additional and perhaps more definite method of estimating tornado strength is by tracking how high the tornado throws debris into the updraft of the storm. There is a direct correlation between the height of the debris and the strength of the tornado. Additionally, the tilt of the TDS can indicate the amount of shear the updraft is under. The lower the tilt, the more shear and vice versa for less shear. Below is an example of a TDS column.
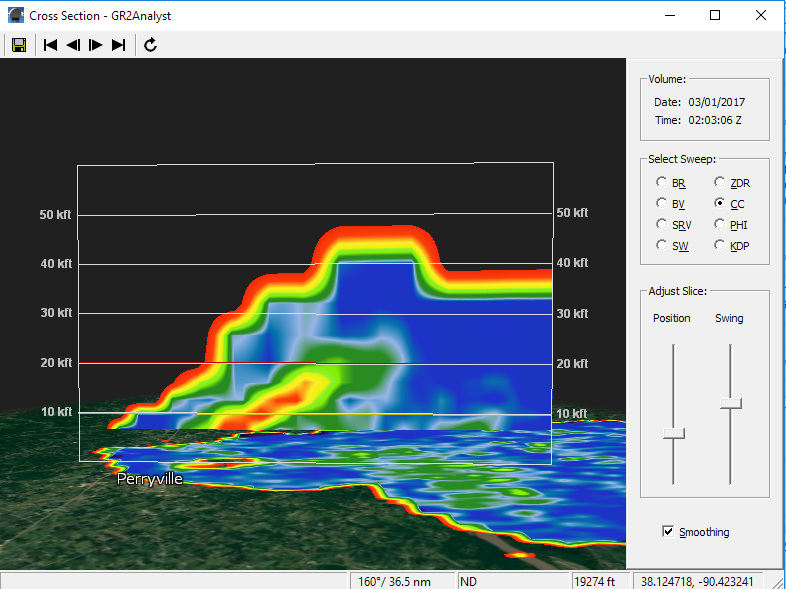
The above image is from the February 28, 2017 Perryville, MO long-track tornado.
This tornado was ultimately rated an EF4 and had EF4 damage ongoing near the time of this image. While the storm was located far away from the radar (around 90 miles) the “finger” of reds / lower CC extends up along the updraft of the storm to around 20,000 ft. Tornado debris signatures that extend this high usually have strong to violent tornadoes underneath. 10,000 feet or so is around the threshold between a “weak” (EF0-1) and “strong” (EF2+) tornado.
While introductory, this short primer on detecting debris signatures and roughly estimating tornado intensity can be used quite well even with limited prior knowledge of radar. If you would like more information on this topic, there are a bunch of academic papers on the subject here.
As a final point, it is important to remember that not all tornadoes are picked up by radar, especial at long distances. Spotters looking up at the sky from the ground are still important. Many tornadoes go undetected each year — depending on what you call a tornado. But that topic is for another day.
James Hyde
Latest posts by James Hyde (see all)
- The Natchez, Mississippi tornado of 1840 - May 7, 2017
- Understanding advanced tornadic radar signatures - March 28, 2017
- Breaking down the Pilger tornadoes of June 16, 2014 - July 16, 2014
Great post and valuable information to me. Thanks for putting it out.