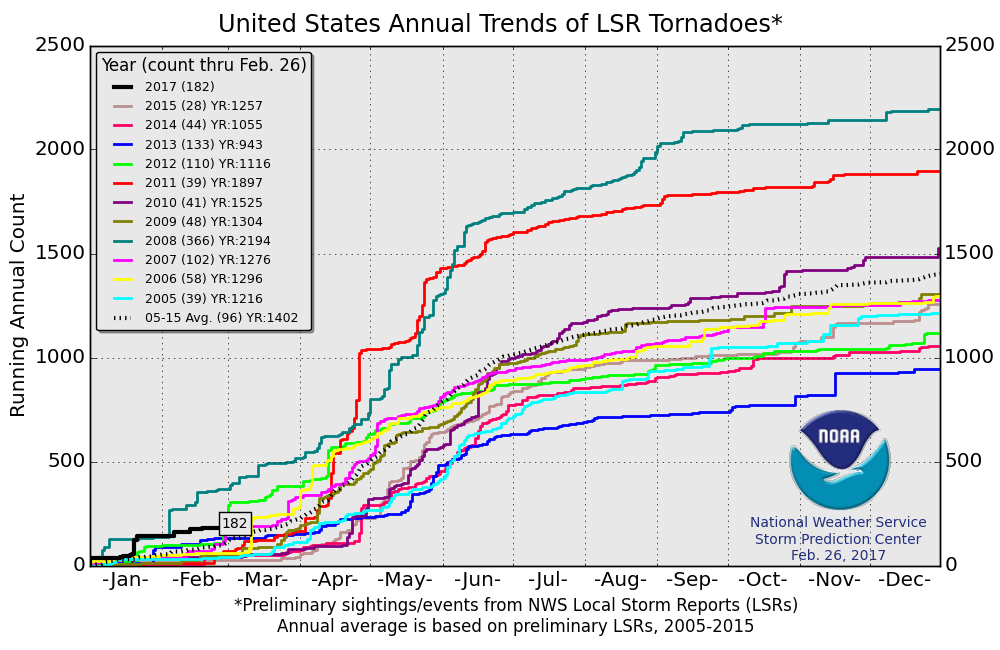
A much warmer than normal start to the year has led to a relatively active tornado period in January and February. Will March, April, and May see a continuation of this trend, or are we on a path to a quieter than normal climatological spring?
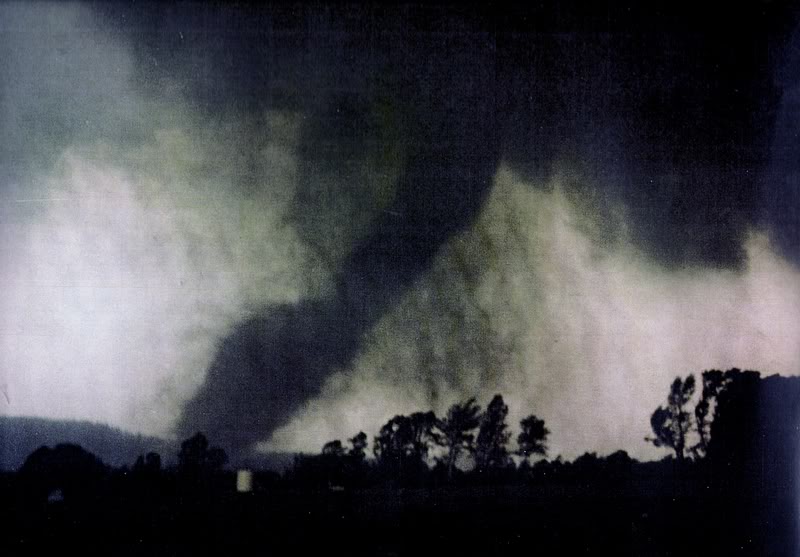
The first two months of 2017 saw a weather pattern dominated by Pacific influences, with storm after storm pounding the West Coast. These storm systems drew a large amount of warm air into the central U.S., which then translated to the eastern U.S. With this pattern in place, there was more opportunity for severe weather and tornadoes, and the result included a significant tornado outbreak on January 21.
[The largest tornado outbreaks of 2017]
Some resemblance of this winter’s pattern will likely continue into March, with a series of somewhat-infrequent but very dynamic storm systems digging into the western U.S. before lifting up into the Midwest and northeastern U.S.
This means that many northern areas not accustomed to early season tornadoes will likely see the biggest uptick in tornado activity in March, whereas parts of the Deep South may be on the lower side of normal when it comes to the tornado count. These storm systems traversing the Northern Tier of the central and eastern U.S. almost seem more indicative of a June weather pattern than a March one.
Overall, I think March will average out to a near normal tornado count to kick off the start of meteorological spring. While we will see continued periods of strong warmth east of the Rockies, somewhat-persistent troughing over the East Coast will try to stifle the transport of rich Gulf of Mexico moisture northward. This will limit the overall atmospheric instability, which is a key ingredient in forming tornadic storms.
Looking into the long range signals for April and May, I took a look at the El Niño-Southern Oscillation (ENSO), Pacific Decadal Oscillation (PDO), and Atlantic Multidecadal Oscillation (AMO).
Though we are technically coming out of a weak La Niña, the atmosphere behaved differently from a typical weak Niña event this winter. Instead, the weather pattern over the Continental U.S. reflected more of an El Niño pattern, with widespread warmth across much of the country and above normal precipitation across parts of the Southern Tier. Not an unprecedented pattern during weaker Niña winters, and it does help narrow down the analog field in the forecast.
The PDO has been positive, but the weather pattern over the western U.S. has been anything but reflective of a positive PDO pattern. Usually, a positive PDO will lead to warmer and drier conditions in the western U.S., but index values do not always tell the whole story, which is why looking at the sea surface temperature anomalies themselves can be more helpful in knowing where the pattern stands going into the long range.
The warmer than normal Atlantic is keeping the AMO positive, which favors a warmer eastern half of the U.S. and drier than normal conditions across the Deep South.
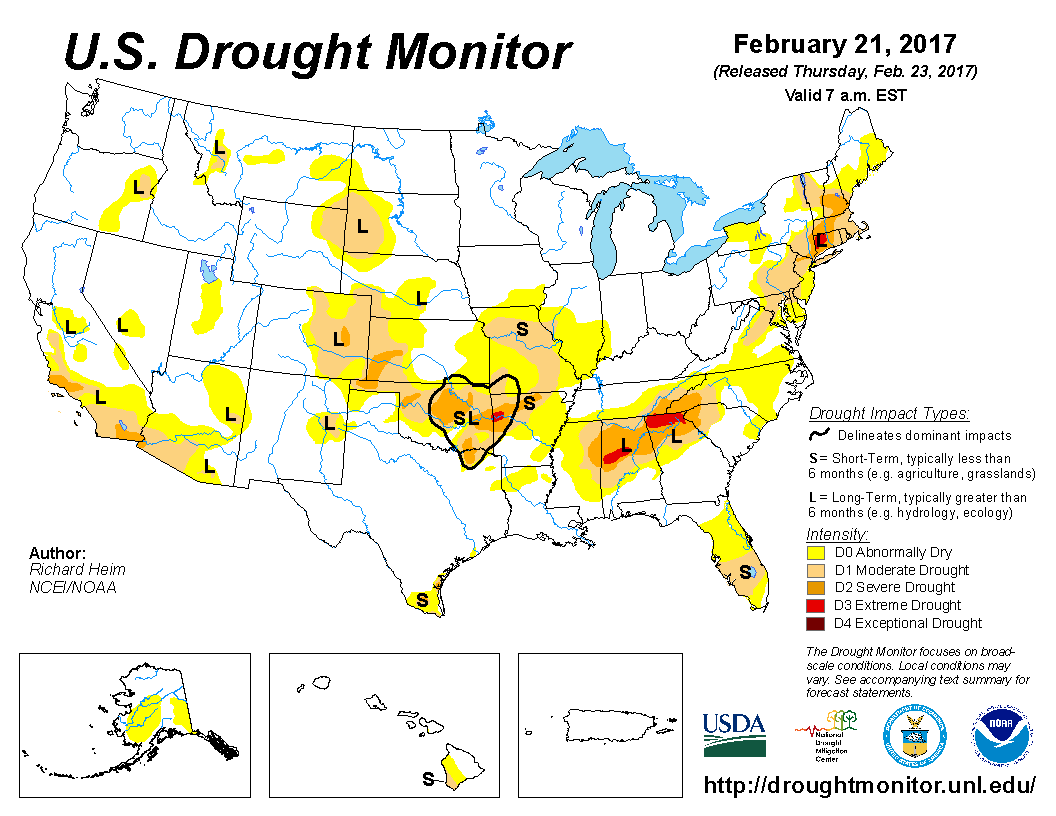
Monitoring the drought heading into spring can be very beneficial. Large areas of moderate drought or worse can create a positive feedback loop. This means that the dry region will be more susceptible to warm and dry weather compared to areas that are not in drought. This spring is starting with patches of drought scattered throughout the country. In my opinion, there really isn’t enough of an area or severity of drought to really indicate long term warm and dry potential, so drought conditions were not weighted.
So weighing in the recent pattern, the shorter-term forecasts, and the main players in the long range, I have come up with four analogs, with different weightings. I like 2006 and 1986 the most, with a lesser weighting on the years of 2012 and 2004.
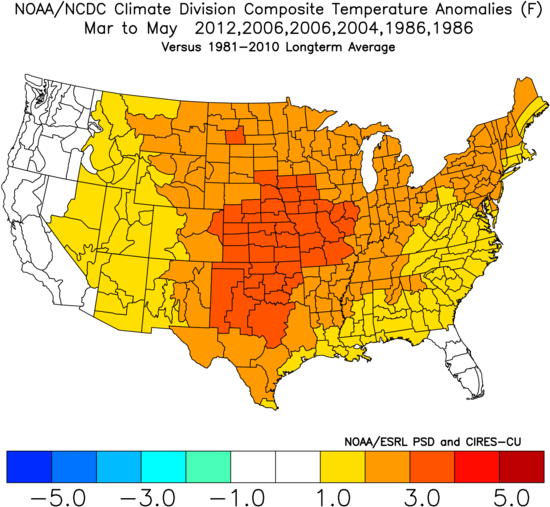
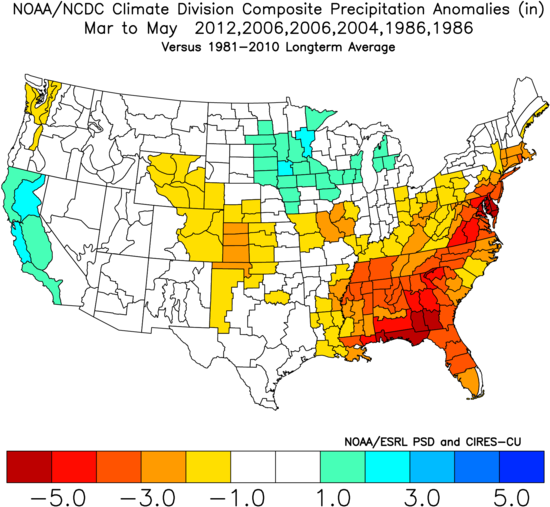
The overarching theme from these years is a somewhat active storm pattern keeping the western U.S. to near normal temperatures and precipitation, while abundant warmth and somewhat dry conditions take over in the eastern half of the country.
Bottom line…
The actual tornado counts of the analog years were somewhat mixed, but they generally favored a normal to active start of tornado season before dropping to a quieter than normal May. Since not all months are created equal, it’s this quiet back part of the season that ends up weighting the spring forecast more toward the below normal side.
While it wasn’t weighted very highly, my analog year of 2004 did produce the second highest May tornado count on record, so there could be some upside potential to the late season.
Odds of the tornado count ending up below/near/above the normal off 511 tornadoes (1991-2010 average) for meteorological spring:
Below normal: 40% (less than 460 tornadoes)
Near normal: 45% (between 460 and 550 tornadoes)
Above normal: 15% (above 550 tornadoes)
Long term forecasts, while generally providing added value to climatology, are still very broad-brush outlooks and do not offer a very consistent level of skill. This forecast only hopes to capture some of the most reliable information available to provide a best guess as to what spring may bring.
Latest posts by Mark Ellinwood (see all)
- Spring 2023 seasonal tornado outlook - March 1, 2023
- Spring 2022 seasonal tornado outlook - March 1, 2022
- Spring 2021 seasonal tornado outlook - March 1, 2021

Conclusion: alot of moving parts void of clear cut pattern; God only knows the random factor. Safest call = “normal”. Thanks for putting this together. Something for us geeks to think about
Agrible forecasting near to slightly above normal 2017 for tornadoes. The year is certainly off to an interesting start! http://www.agrible.com/blog/2017/2/28/agrible-predicts-higher-risk-for-tornadoes-in-2017