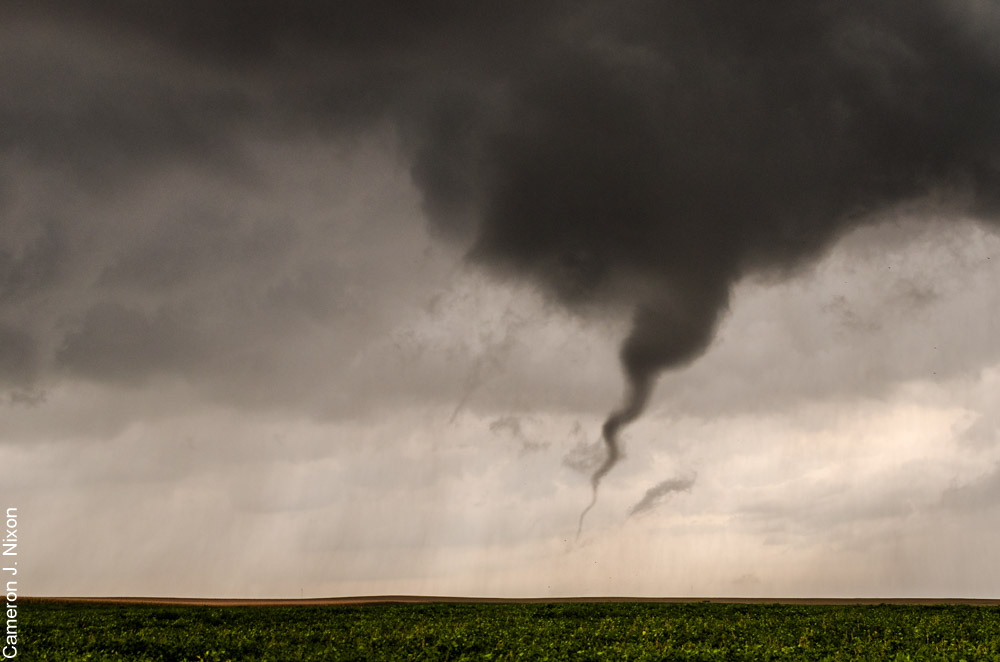
As the winds of change woosh in once again with the sounds of thunder, sirens, incessant phone vibrations, and excited meteorologists, severe weather makes its rowdy return to the United States.
Weather nerds span a plethora of jobs and lifestyles, each of us with different educations, inspirations, and experiences. This is one of the best parts about our field. We wouldn’t be capable of half the expertise or impact on our communities if it wasn’t so. But it also lends itself to some misinformation, misunderstandings, and miscommunications when it comes to warnings, broadcasting, spotting, and even research.
So what are some of the biggest myths when it comes to forecasting, spotting, and communicating severe weather? We’ve got you covered.
Myths on my mind
Myth: [I am, you are] smarter than [the Storm Prediction Center, your local National Weather Service, your town’s broadcast meteorologist, etc.]
Let’s get this one over with swiftly:
- Do you have experience serving [in the Storm Prediction Center; in your local National Weather Service; as your town’s broadcast meteorologist]?
If you answered “no” to any of these questions, chances are that there are at least a few parts of the job that go unannounced and unappreciated to anyone outside the building.
Just be nice 🙂 We’re all human.
Myth: Higher Significant Tornado Parameter = stronger tornadoes!
Myth: I’m smarter than that… higher supercell composite = greater supercell potential!
Significant Tornado Parameter (STP): A staple in tornado forecasting since showing skill in published research when it comes to distinguishing between the environments of weak (EF-0 – EF1) and strong (EF-2+) tornadoes. Think the day may go “violent” and “long-track” based on STP alone? Think again! Many forecasters have gotten smart about this parameter over the years, acknowledging that most tornadoes prefer the “SigTor gradient” over the “bullseye.” Although plenty of tornadoes can be found in the “bullseye”, this statement does have some merit, since gradients delineate abrupt changes in CAPE, low-level SRH, or LCL height, which often coincide with boundaries / sources of lift (warm fronts, outflow boundaries, drylines, or cold fronts).
Supercell Composite Parameter (SCP): This became a perhaps even more relied-upon recipe of ingredients for severe storm forecasting after showing skill in distinguishing between environments supportive, and not supportive, of supercells. No studies have been done on whether or not supercells become stronger in higher SCP, so exercise great caution— especially with straighter hodographs, where intense supercells can result in very low SCP. What’s more, SCP’s formula assumes a supercell already exists! So, also exercise caution when using SCP to determine whether or not a storm will become a supercell—especially again with straight hodographs. Even more? In almost all displays, A glance at SCP will fail to tell you whether or not conditions are favorable for left-moving supercells, or elevated supercells, which is less than ideal for forecasting since both types of supercells can produce especially copious amounts of severe hail. So while SCP has proven to correlate with environments conducive for surface-based right-moving supercells, it may not be so reliable for other cases. And when that beast of a left-moving hailer north of the warm front comes crashing through your windshield, don’t blame the SCP.
Myth: The dreaded “veer-back”… The bane of all [tornadoes, supercells]!
If you despise even the sound of these two distasteful words, you’re not alone; speculations of veer-back’s impacts on rotating storms are still routinely sprinkled into public forecast discussions.
In a “veer-back” wind profile, winds first turn clockwise with height (say, from southerly to southwesterly) in the low-levels, then turn back counterclockwise above this (perhaps to more southerly again). The truth is, we simply don’t know enough to let this old adage take over our forecast, and there’s even emerging evidence (like this “controversial” paper) that suggests that some degree of backing above 3 km is beneficial for supercell strength and longevity in certain situations. Indeed, many intense, long-tracked tornadoes have occurred throughout history with substantial veer-back, which even raises the question, could veer-back be better for tornadoes?
So, wait… veer-back is a good thing? Not so fast… there is one indirect effect of veer-back that could ruin a tornado day, and that’s its tendency to scoot storm motion northward and more parallel to the cold front or dryline, encouraging upscale growth into messy, unorganized clusters. What’s more? No work has been done on veer-back below 3 km; so if you see those wretched “kinks” in that red section of the hodograph, there’s still a chance supercells aren’t in the cards (no matter how much SRH you have!).
But, the “veer-back may weaken supercells today, thus decreasing our chance of tornadoes by inducing opposing pressure perturbations aloft, sort of like stirring a teacup then messing it all up by swirling around the other way” that you’re about to throw in your discussion? It’s time we laid this one to rest.
Myth: The super-rapid high-resolution 1km nest research model is the best model.
Let’s face it: to those of us who don’t design the models, the models are complicated!! But they all have one thing in common: they’re designed to predict something:
- GFS / Euro: to predict the future state of synoptic weather patterns around the world
- NAM: to predict the evolution of mesoscale features given a synoptic setup within and around the United States, calibrated with the tropical southeast climate in mind
- RAP: to predict the evolution of mesoscale features given a synoptic setup in an even smaller domain within and around the United States, but calibrated a bit toward its drier continental climate
- Convective-Allowing Models (HRRR, 3kmNAM, HRW WRF, TTU WRF, etc.): to predict what convection may look like given a mesoscale setup.
So, with that in mind, would you:
- Use the GFS to predict values of CAPE this afternoon in central Kansas?
- Use the HRRR to predict how much snow may pile up on your patio table tomorrow?
- Use the NAM to predict the arrival time and intensity of the big synoptic low three days from now?
- Use the RAP to forecast how long the mist and stratus will linger today over northern Alabama before clearing out?
- Use the 3km NAM to predict the dry, dusty winds of West Texas after the Pacific front plows through this afternoon?
Models are a handy tool to have. But remember, each serves a purpose, and knowing their purpose will help you understand their biases. Do your research!
Myth: Tornadoes “touch down.”
Myth: I’m smarter than that… tornadoes form from the ground up!
Many storm chasers enjoy keeping track of their spoils. Truth is, knowing what’s actually a “tornado on the ground” (a redundant but apparently effective phrase) is pretty valuable information for any eyes.
As model simulations of tornado formation break new ground (especially from Dr. Leigh Orf’s group at the University of Wisconsin-Madison: http://orf.media/), we’re beginning to learn that tornadoes may in fact form from both “top-down” and “bottom-up” processes.
What does this mean? In all likelihood, the vast majority of “maybe-nadoes” out there are indeed “on the ground”, since tornadoes theoretically require a surface vortex to start the process (if there’s any exception, it’d be with large CIN or a stable layer, but the supercell must be quite intense to overcome this). The surface vortex is then stretched and strengthened by the storm’s updraft, and built downward by the “dynamic pipe effect”.
So, you’re probably saying, “Shouldn’t I just report every funnel I see as a tornado??” Not so fast… just because there’s a surface vortex under that cone, doesn’t mean it’s tornado-strength (or even severe-strength!). As always, REPORT WHAT YOU SEE. But for your years-running tubes-I’ve-seen spoils scorecard, well… there’s probably nothing wrong with counting it. 😉
Myth: Helicity swaths are tornadoes.
Myth: I’m smarter than that… helicity swaths are supercells!
As Convective-Allowing Models (CAMs) continue to improve with advancements in programming, we may feel more comfortable each year trusting their “realistic” output.
Here’s how CAMs work:
- Data is “assimilated” (brought in) into them from observations, as well as “best guesses” from their “parent” models (like the RAP, NAM, etc.) to fill in the gaps (some experimental research models like the NSSL Warn-on-Forecast System even assimilate “actual” supercells observed via radar and satellite!)
- Numerical modeling works as usual, predicting the likely short-term thermodynamic and kinematic environment
- “Convective allowing” means that these models allow free convection to happen, instead of parameterizing it like mesoscale/global models do (which is why simulated reflectivity looks so much more realistic on the HRRR than on the RAP)
- “Resolution” is not 3km for the 3km CAMs! That 3km is the grid spacing; because models typically need ~5-10 grid points to resolve something (try drawing a “W” with only one point… it’s not easy!), the resolution of most CAMs is about 15-30 km (~9-19mi); this means that most supercells are just on the edge of what CAMs can resolve!
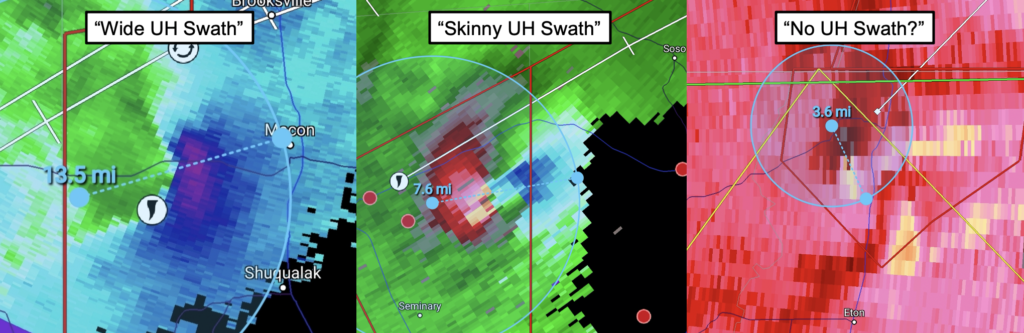
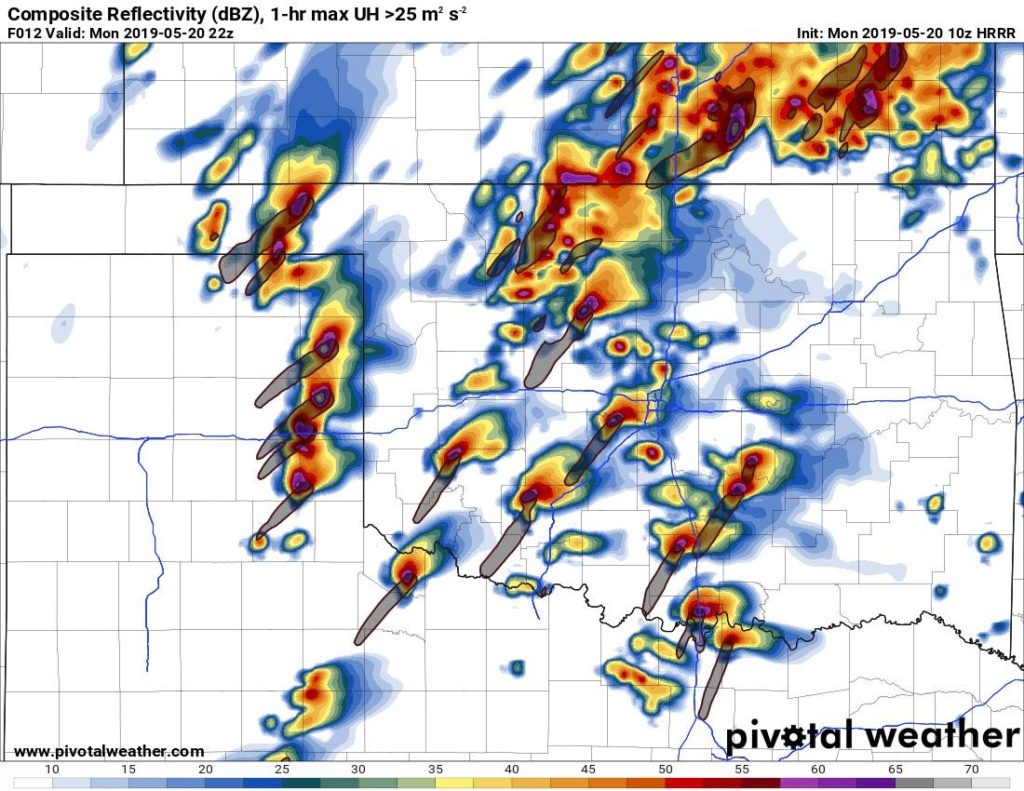
In a perfect world, let’s say the 18z HRRR modeled, with 100% accuracy, the three storms above from the 2020 Easter Sunday severe weather outbreak. By misusing “UH swaths” to predict tornadoes, a user could have diverted their attention away from the powerful tornado near Soso (middle) and toward a weaker and briefly tornadic supercell near Macon (left), and missed another tornado near Eaton (right) entirely! All due to what the model can resolve.
So, how can we use “UH swaths” properly?
- Modeled supercells may be stronger or weaker, bigger or smaller, depending on which model you use (and regardless of the environment!)
- Updraft helicity is a product of both the 1) rotation and 2) vertical motion in an updraft; so, high UH may very well mean an extremely strong updraft with minimal rotation! This is especially common in large convective complexes
- Updraft helicity is predominantly calculated in the 2-5 km layer; thus, although studies have been done on their correlation to tornado potential, they are in no way modeling tornadoes, just like Doppler Radar (most often) is not detecting tornadoes!
- Wide, strong UH swaths mean wide, strong mid-level mesocyclones! This does not necessarily correlate with tornado potential; in fact, many such supercells are most efficient at producing large hail.
- Narrow, weak UH swaths mean narrow, weak mid-level mesocyclones! Don’t be fooled, however… plenty of significant tornadoes occur with narrow, “mini” or “low-topped” supercells in “low CAPE” events, where heavily tilted updrafts register less vertical motion, and much of the kinematics are confined to the low-levels of the storm; since UH doesn’t consider those lowest 2km, using it wrongly can let some significant events fly “under the radar”
- Be sure to use the Storm Prediction Center’s HREF, which also displays anticyclonic updraft helicity; since left-movers at times produce even more severe weather than right-movers, it’s a good idea to remember that there is guidance for that, too!
We still have a lot to learn as to how the models we use forecast supercell storms; for now, you’re much better off understanding Skew-Ts and hodographs first!
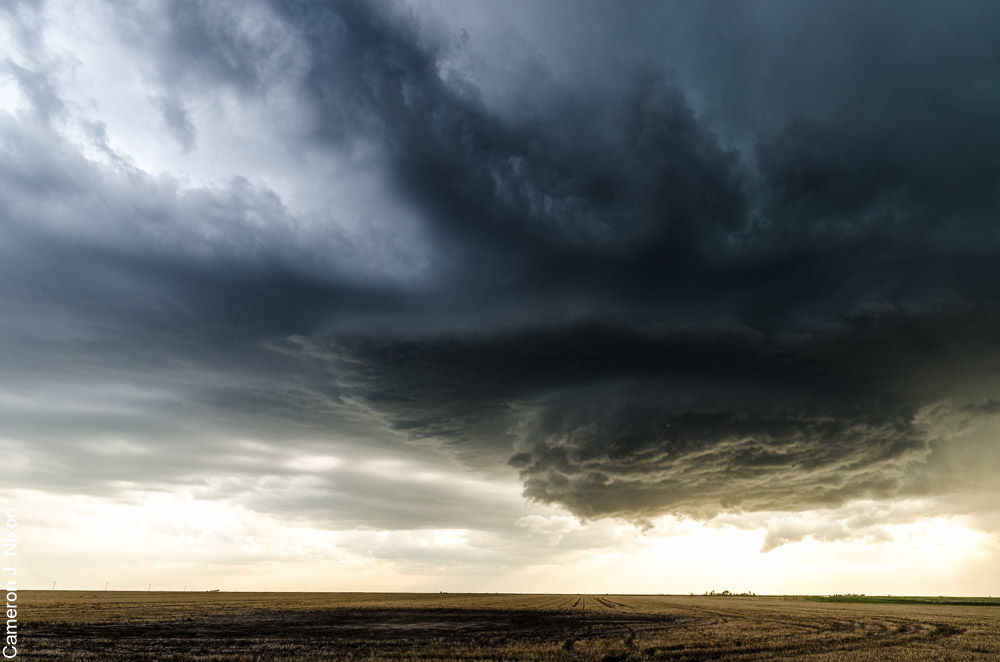
Myth: This storm is [high-based, elevated, surface-based].
Those three phrases are perhaps the trickiest for storm spotters to differentiate; and with good reason… they all sound the same! Let’s break them down:
- High-based: This refers to the base of the updraft’s cloud structure, commonly estimated using lifted condensation level (LCL) or convective condensation level (CCL). A high-based storm is generally less apt to produce tornadoes, but more apt to produce damaging winds. Low-based storms are generally more apt to produce tornadoes.
- Elevated: This refers to a storm’s inflow being drawn from a level above the surface, due to the presence of a layer of cold, stable air beneath it. Elevated storms are often found north of warm fronts or outflow boundaries and may produce large hail. Think your storm is “elevated” because its base is high? Think again! It is probably still taking advantage of dry, but very warm and buoyant inflow mixing all the way up from the surface; what’s more, reporting it as “elevated” typically means you’re telling the forecaster that its days of producing damaging winds and tornadoes are over!
- Surface-based: This refers to a storm’s inflow being drawn from the surface. A common excited exclamation among storm chasers is “it’s becoming surface based!” as the scuddy base lowers toward the ground. Chances are, it’s just in the process of condensing at lower levels as it ingests rain-cooled outflow air, and was really surface-based all along! And conversely, be careful; not all scud-sucking storms are surface-based!
Myth: Green meets red… it’s tornado time!
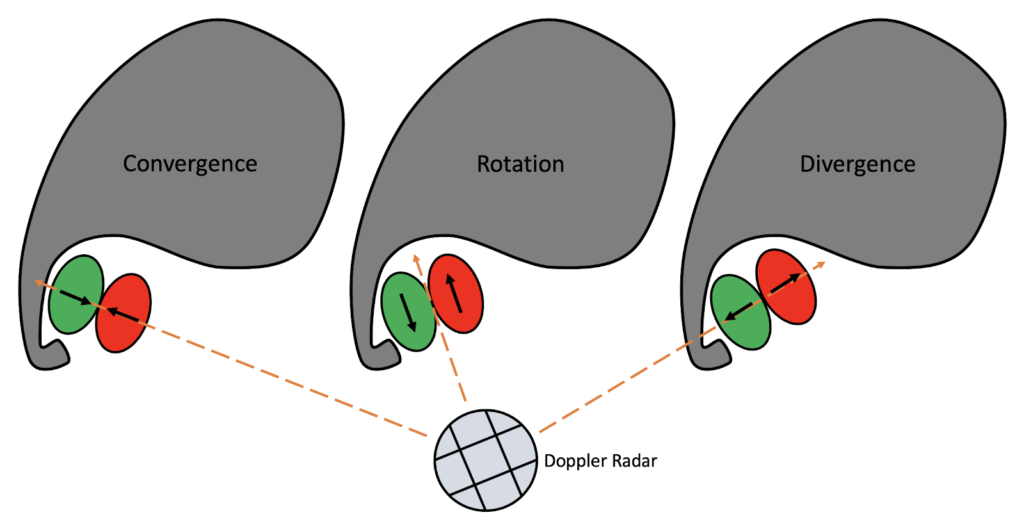
Doppler velocity is a crucial tool for monitoring rotating storms; however, it can easily be misused by forecasters in just about any position. Velocity “couplets” are where the green meets the red… but these don’t always mean rotation!
Pay very close attention to the orientation of the couplet with respect to the direction of the radar beam. If the reds and greens are separated across the beam, you’ve got yourself rotation. However, if the reds and greens are separated along the beam, that’s just convergence, or divergence. A convergence signature within supercells (especially when orientated 45 degrees across the radial, such that both convergence and rotation are present) may mean the tornado threat is ramping up; in most other cases though, it’s simply a strong updraft, or a strong downdraft or microburst.
Velocity aliasing and spurious signals from beams bouncing off hail and other scatterers can also make convincing “fake” tornadoes, so be sure to check higher tilts and previous scans to make sure what you’re seeing is continuous.
Most importantly, always consider the observed environment! Yes, it’s never a bad idea to keep slapping warnings on a particularly nasty storm till it’s long dead, but if it just strolled from a balmy warm sector into a 45-degree zone, it may be about time to let your guard down for anything but some hail.
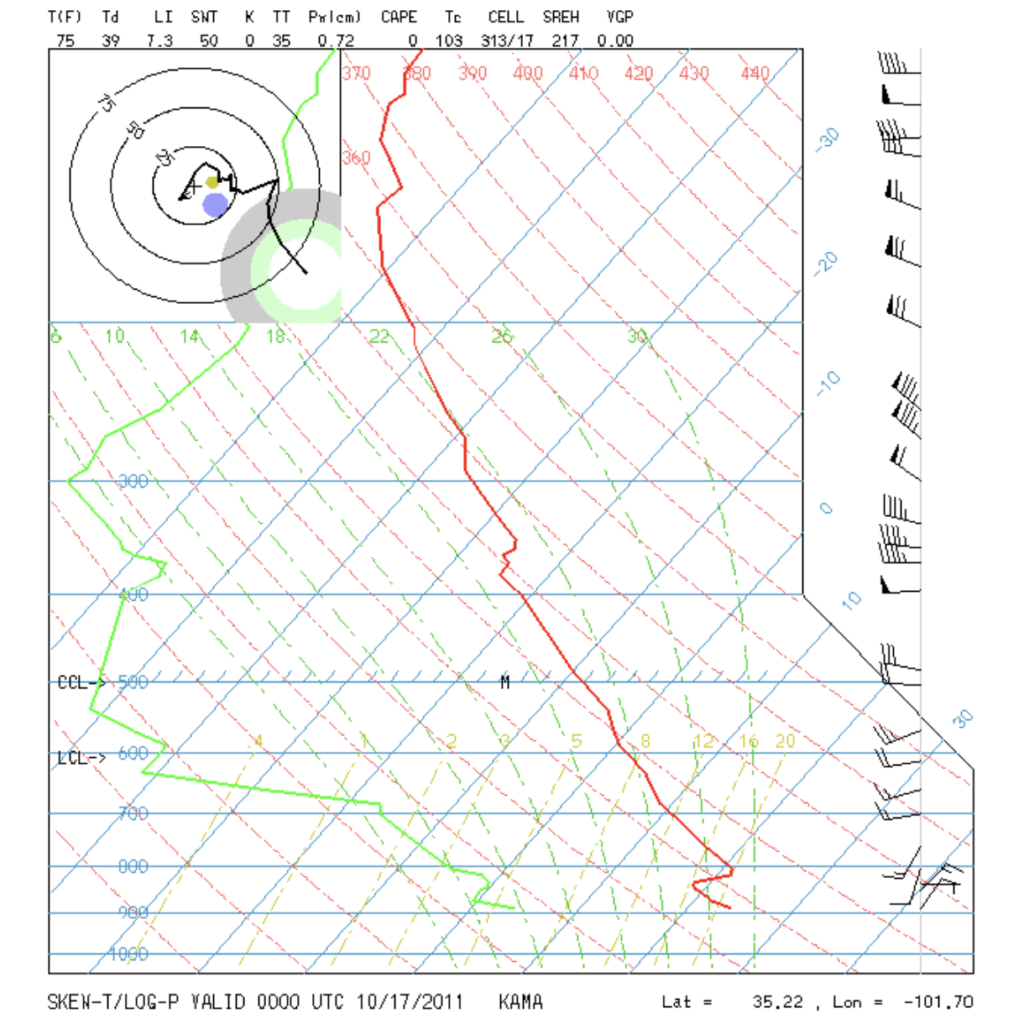
Myth: Tornado threat is low, because surface winds aren’t backed enough.
Myth: I’m smarter than that… tornado threat will be highest near any boundaries!
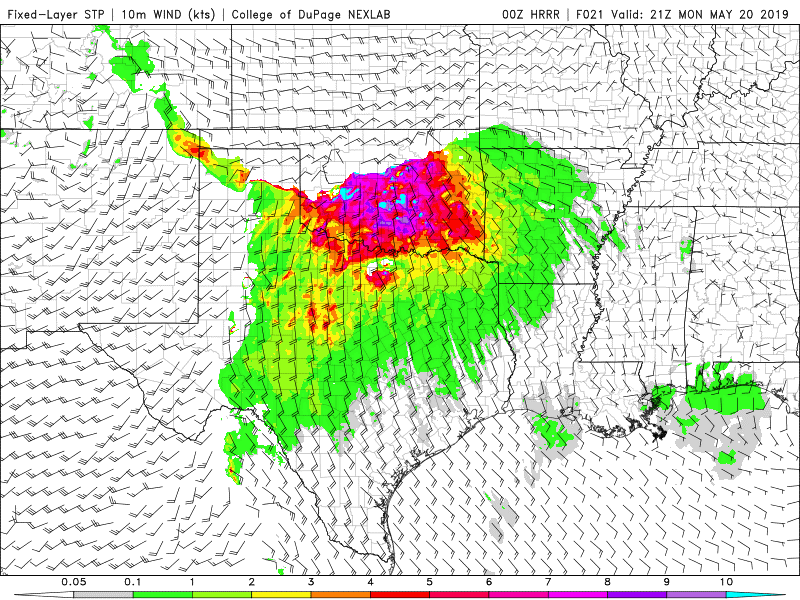
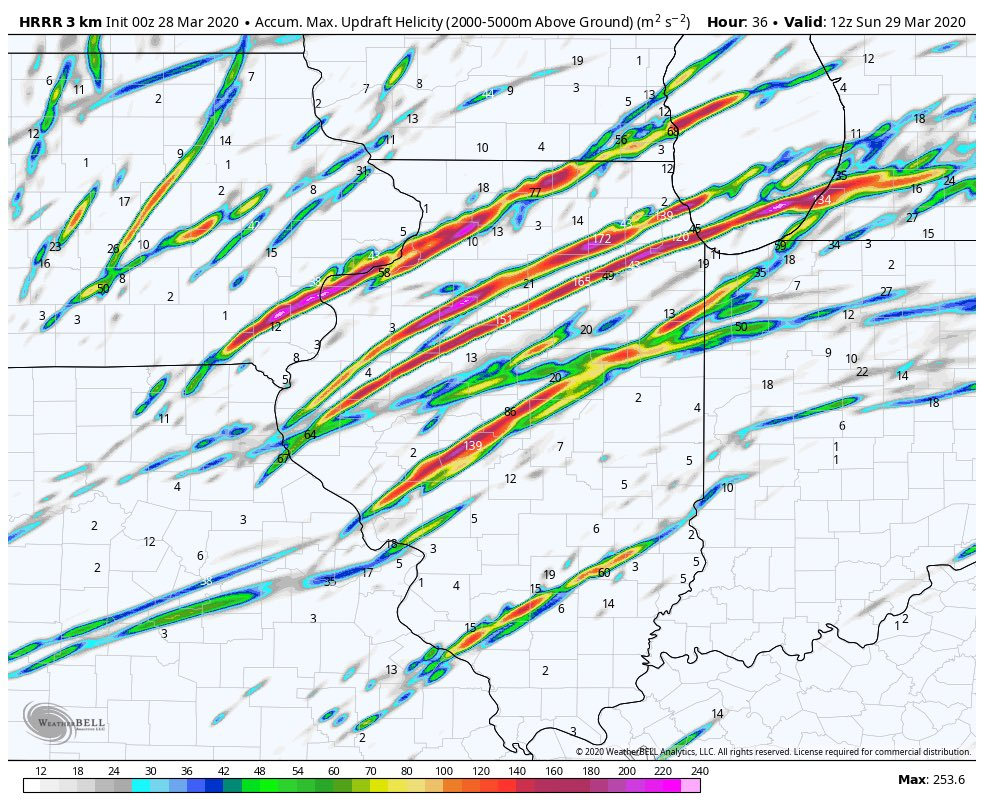
I’ll cut straight to the chase: tornadoes need lots of streamwise vorticity, and this is a storm-relative magnitude. Streamwise vorticity can only be assessed by looking at the hodograph! In many, many situations, “veered” southwest winds can still create lots of streamwise vorticity, especially in northwest flow setups like the one shown above.
What about the second part? We all want to be near the boundary. Right? This idea can be quite overused in forecast discussions.
When there’s screamin’ shear and large storm-relative helicity just about everywhere, boundaries provide little more in the way of assistance that would make a noticeable difference on tornado potential (in some cases, they may even contort hodograph shapes to discourage tornadogenesis!). And, most importantly, in countless cases of open warm sectors with strong southerly flow, any notable boundaries “mix out” and disappear quickly, or don’t even exist in the first place!
Got weak deep-layer shear, high CAPE, and a stubborn outflow boundary in Kansas in May? By all means, this phrase belongs in your discussion! Got a strongly-sheared open warm sector with sunny skies abound? You may have bigger problems…
Bonus mythbust: sitting near a warm front with strong shear above your head, but thinking the surface winds are just “too weak” for tornadoes? Think again! Weak surface winds actually strengthen shear and increase low-level SRH, heightening the potential for tornadoes in most cases.
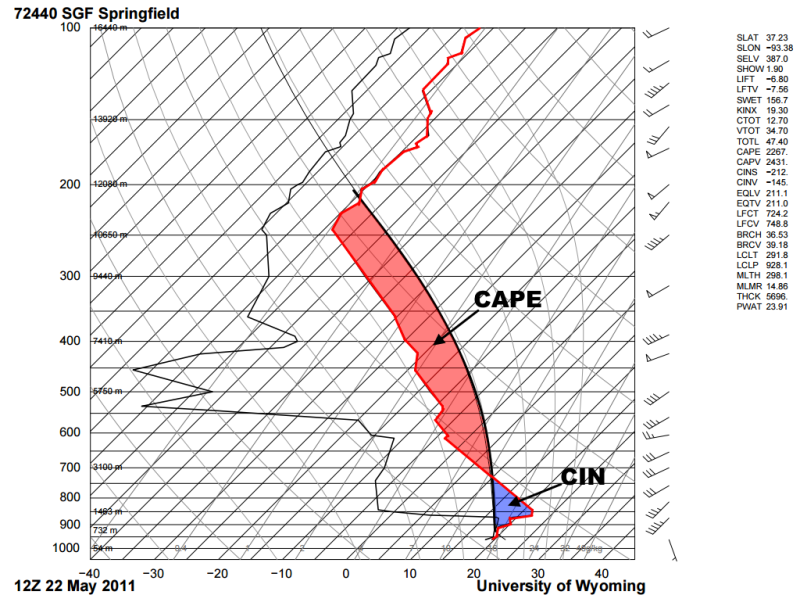
Myth: The “Loaded Gun” sounding is how we get big tornadoes!
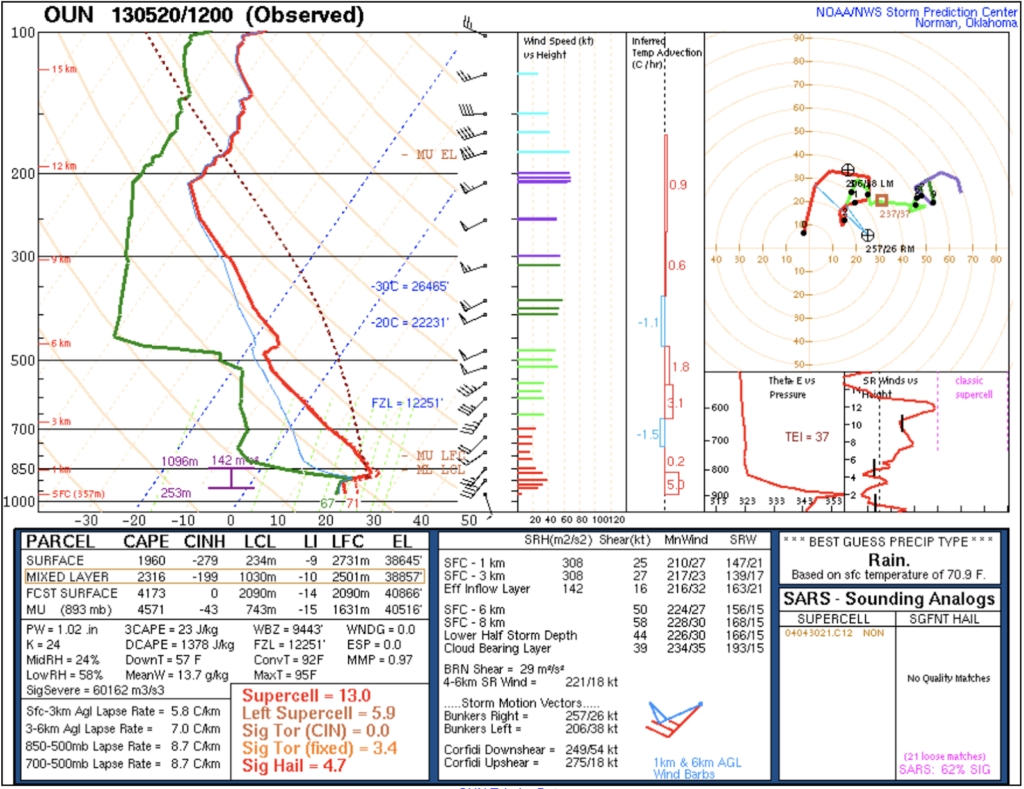
Loving the loaded gun depends on the situation. Seeing this sounding in the morning as a deep upper trough approaches and warm, moist air filters in? You may be looking at a tornado outbreak, as long as the shear is there to compliment those steep mid-level lapse rates and high CAPE.
However, seeing this sounding in RAP analyses in the late afternoon? You may run into some problems forecasting tornadoes. Although high values of CAPE and the stout “cap” (convective inhibition, or CIN) characteristic of such a sounding can create intense and highly isolated supercells, it’s often very hard for all but the strongest of supercells to stretch and amplify any low-level circulation into a tornado without any low-level instability – especially when convective inhibition is present.
What should you look for instead?
Sufficient low-level CAPE, or “3CAPE” (especially >~100 J/kg) on most modeled sounding readouts! Indeed, abundant 3CAPE (especially >~150 J/kg) may be all that’s needed to stretch a dash of surface vorticity into a weak but full-fledged tornado, even without the help of deep, “fat” CAPE!
This is just one reason why the summer months routinely dish out “surprise” tornado events even when “sufficient” shear, or even deep-layer CAPE, is missing in action.
Myth: I am doing a service to my [Twitter, Facebook, TikTok? etc.] followers by posting storm photos!
TAG THE LOCAL NATIONAL WEATHER SERVICE OFFICE!
Include the state’s #wx hashtag (e.g., #okwx for Oklahoma) as well, so broadcasters and other authorities monitoring it can see your report. Isn’t that why you’re a spotter in the first place?
Believe it or not, photographic evidence of severe weather is far more important to the National Weather Service, broadcasters, and emergency management than to your “armchair-chasing” follower across the country. A picture is worth a thousand words. Or, better yet, in certain situations when observing ongoing destructive weather, give them a call.
NEVER assume that what you’re seeing has already been correctly reported.
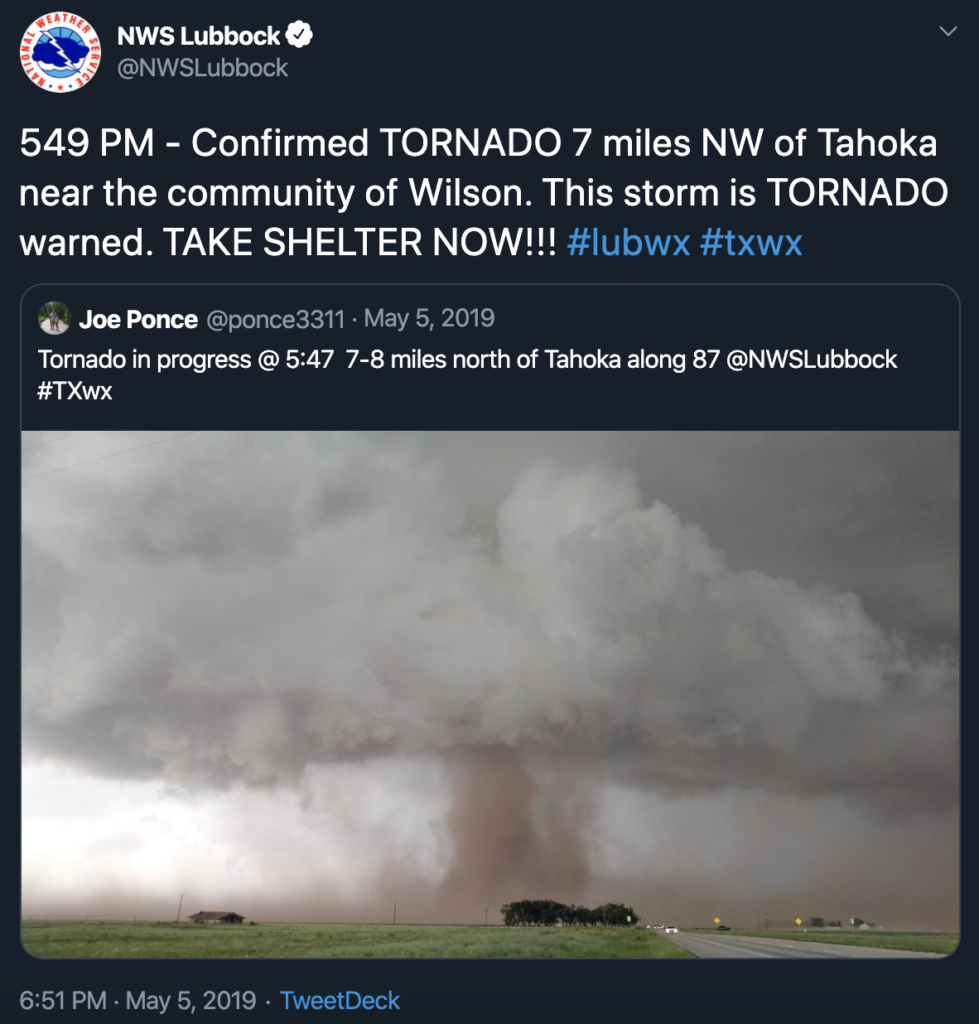
That’s an A+ example of useful online reporting by Joe.
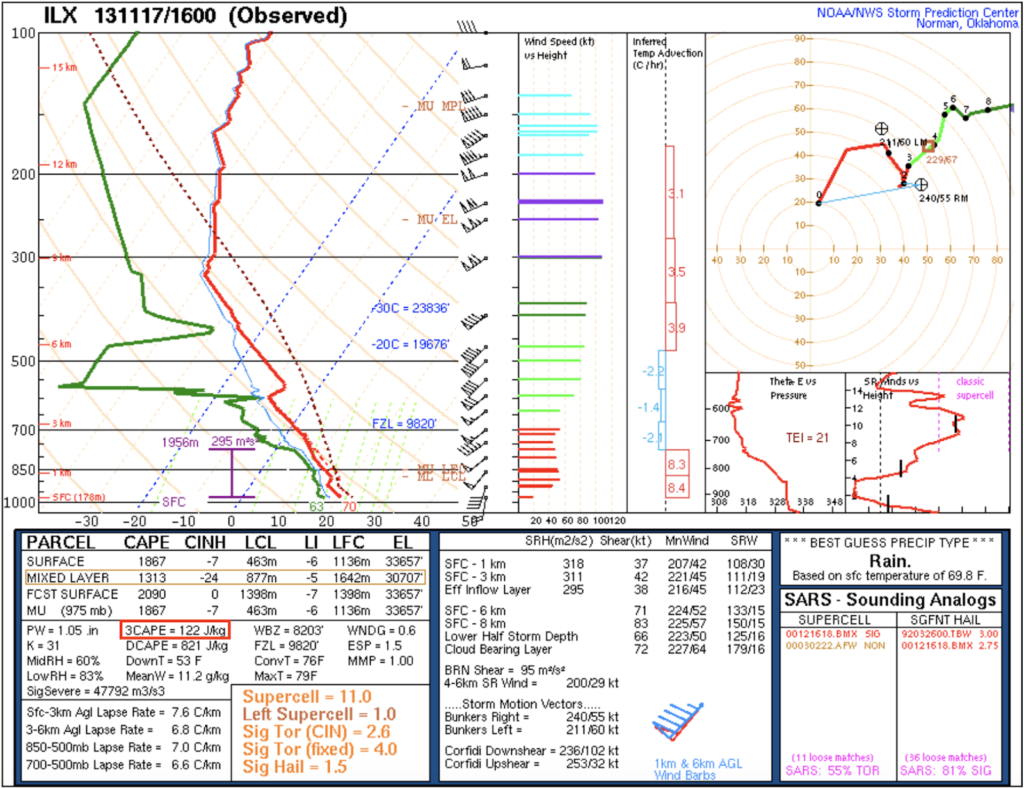
Myth: The supercell will turn right.
Another controversial statement! You may have used “storm motion” (Thanks to Dr. Bunkers of the National Weather Service in Rapid City, SD). All supercells deviate rather consistently from the mean wind. However, the deviation you’d perceive in a ground-relative sense may look quite different case by case.
With weak low-level winds under screaming mid- and upper-level flow, supercells will visibly make that classic “hard right turn.” However, in scenarios with faster storm speeds, a supercell’s right turn may be very subtle!
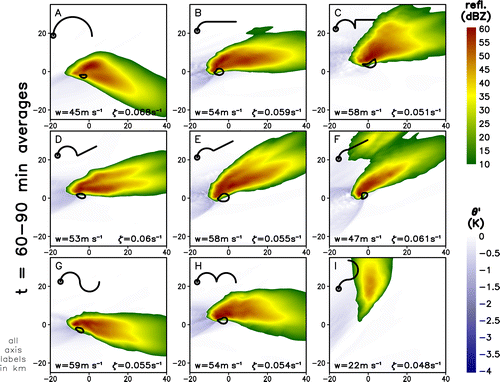
A lack of “deviation” from a ground-relative sense can puzzle forecasters, and if you’re debating as to whether or not the supercell has gone deviant, if it has a hook, it has gone deviant! Maybe even long ago. In some cases where hodographs are large and circular, this deviation may be perceived as simply a slowing-down, or stationary “anchoring.” In extreme situations, especially near hurricanes, the supercell may even appear to start moving “left!” Be warned: if it is rotating counterclockwise, it is a mature supercell, and can produce tornadoes.
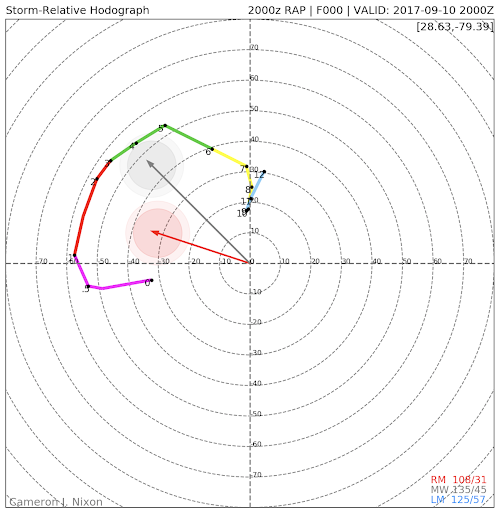
With the above hodograph, an initially northwest-moving storm (grey mean wind vector) will turn to the left to almost due west in the ground-relative sense as it becomes a cyclonic supercell. It’s still making it’s classic “right turn” with respect to the deep-layer shear, but that’s not at all what you see!
This modeled sounding was taken in the outer bands of Hurricane Irma, where an outbreak of supercells likely produced numerous tornadoes over the Atlantic Ocean.
Want to deep dive? Check this paper out.
Myth: There’s not enough upper-level support for severe weather today.
To get a storm, we need a surface feature to lift warm, buoyant air upward. But for those of us with a meteorology degree at least, weren’t we all taught that synoptic lift occurs in the upper-levels too? Of course!
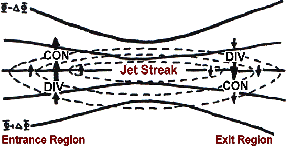
However, when dealing with surface-based severe weather, lift becomes decreasingly substantial and much less relevant the broader-scale and higher up you go. Synoptic scale lift simply occurs on too long a timescale to be sufficient for convective initiation (unless perhaps we’re dealing with isentropic lift and elevated convection), so there’s really not much use in saying “convective initiation will be most likely in the left exit region of the jet streak,” for example.
Indirectly, synoptic scale features are still incredibly important in assessing severe weather, as the left exit region of the jet, for example, is likely where the mid-levels are cooling most dramatically (higher CAPE), or where low-level wind fields are strongest (stronger shear).
For a deeper dive, here’s a demonstration by the Storm Prediction Center’s Rich Thompson: https://www.youtube.com/watch?v=rhTIorvcjXw (while you’re at it, feel free to binge-watch all his demonstrations)
Myth: BIG troughs = BIG trouble!
Most of us are taught, through school or practice, that the bigger the trough, and the more negatively tilted it is, the higher the potential for an outbreak of supercell storms and tornadoes. To sort this one out, let’s explore what a “big trough” does to:
Forcing: Bigger, more negatively-tilted troughs imply stronger systems from the ground up. This means stronger gradients in wind and temperature that may result in stronger drylines, faster cold fronts, or sharper warm fronts that are much more efficient sources of lift.
The downside to this? Lots of storms!
Highly amplified troughs may be great for long Quasi-Linear Convective Systems with widespread severe wind, plenty of (usually) short lived and difficult to warn tornadoes, plus “dirty” warm sectors with lots of morning hail. But if you’re looking for discrete supercells, you may not always find them here.
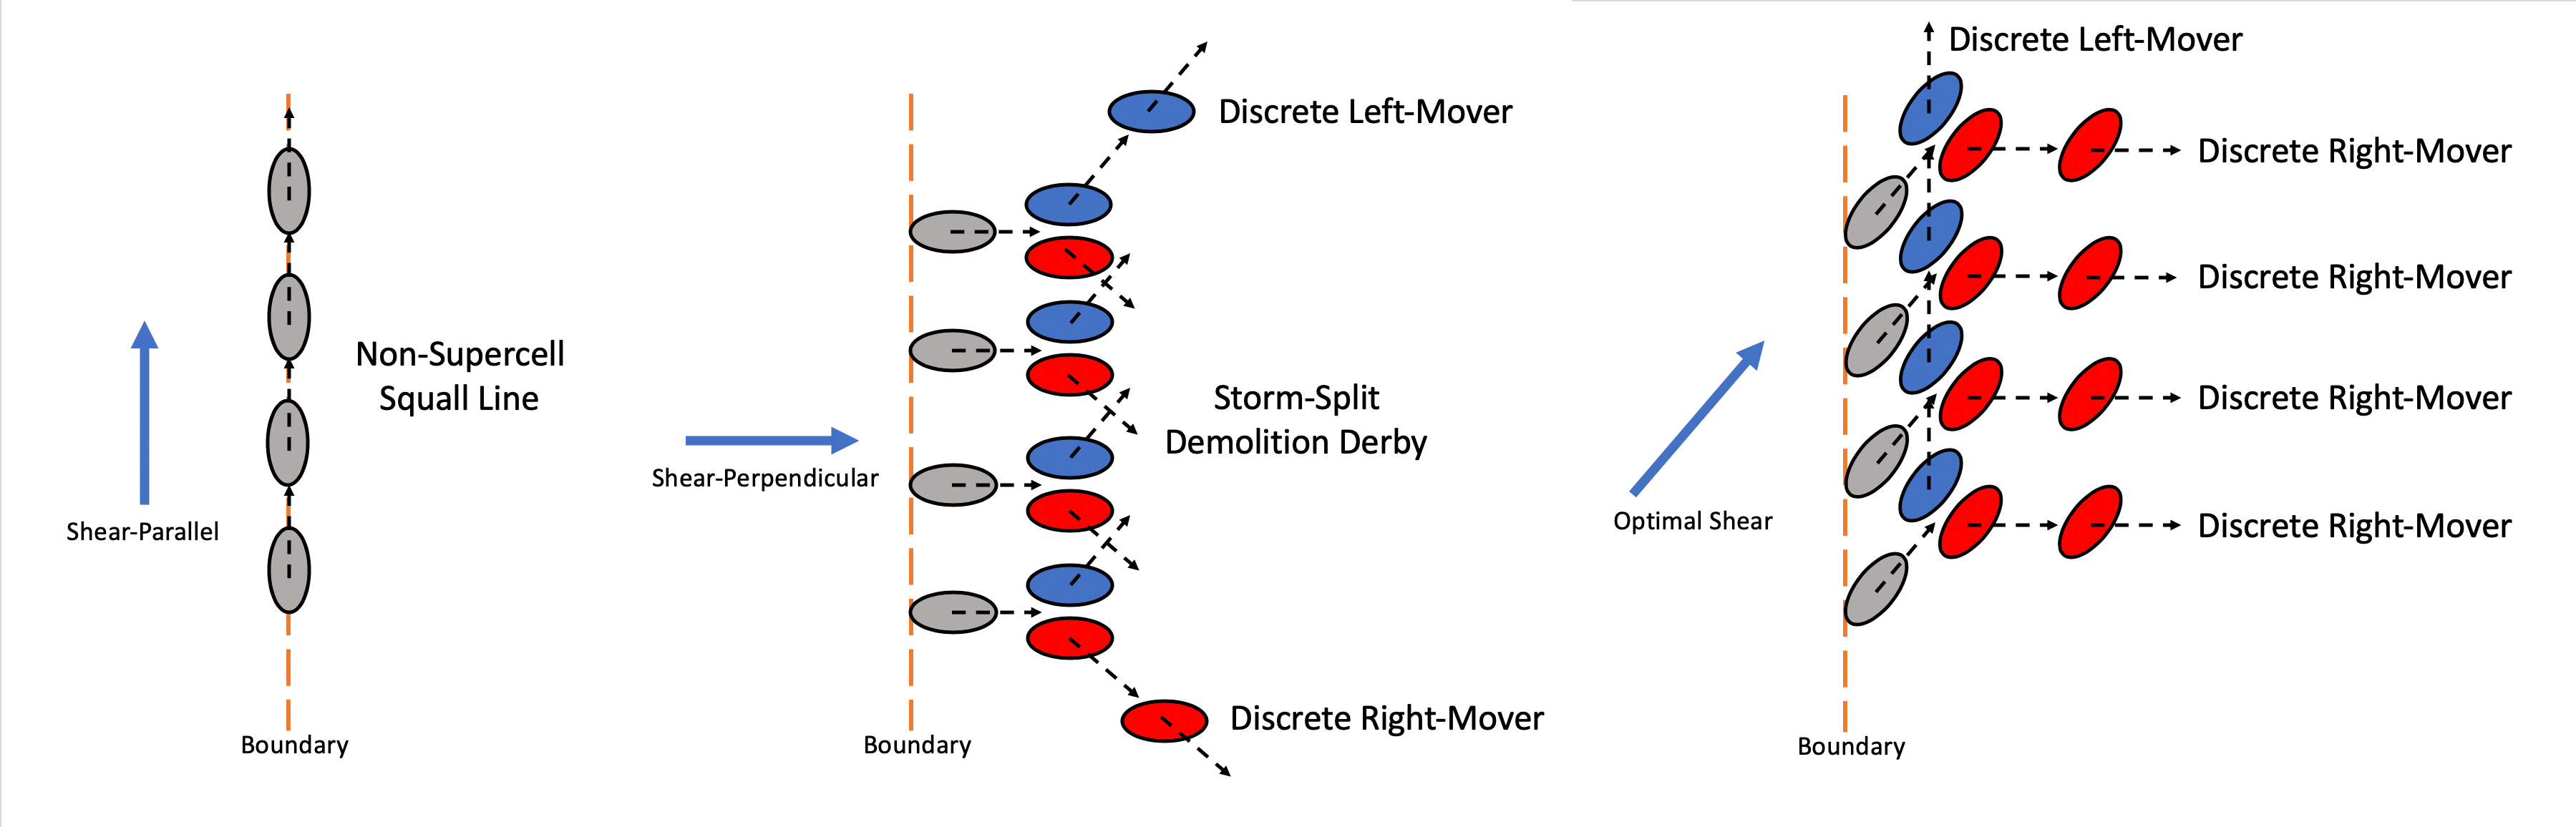
Shear Angle: Before supercells are born, infant updrafts move with the deep-layer mean wind (often estimated with deep-layer shear, though this can occasionally run you into some problems).
Why does this matter? The angle of the mean wind with respect to the initiating boundary can control whether or not these updrafts can even become supercells!
If the mean wind is oriented parallel to the cold front or dryline, any infant updraft may not even be able to make its first steps off the boundary and into the warm sector to become a supercell. This is predominantly the case with stronger troughs, since these imply more meridional upper-level flow which steers updrafts northward, along the north/south cold front.
So, you may be asking, “the solution is shear perpendicular to the boundary, right?” Not so fast…
Once an infant updraft takes its first steps, it loves to start splitting in higher shear; perpendicular shear angles encourage both right and left-splits to have equal space to interact and play, which can get quite loud and messy. This is often the case with strong, zonal flow without much in the way of a strong cyclone. The optimal shear angle in most of the country, in most cases, is about 45 degrees; this allows right-movers to roll off the boundary while those pesky left-movers are left in the dust.
And, you guessed it, this means the potential for very long-tracked supercells with just your average, nothing-special, upper-level trough.
Myth: Dry air aloft is good for severe weather.
This statement depends on the situation.
Perhaps you were taught that dry air is good for severe weather since it leads to more substantial evaporational cooling, which produces stronger downdrafts. This is correct! No myth here.
Dry air aloft also indirectly increases CAPE, by allowing mid-level lapse rates to steepen with low-level heating.
However, be cautious when using this in scenarios that apply to supercells or other storms in strongly-sheared environments. Especially when surface forcing is weak, updrafts forming in dry air aloft must battle the entrainment (or “mixing in”) of air parcels which by definition are much less buoyant, leading to the appearance of being “sheared apart” (another questionable phrase).
This can lead to weak, or even miniature, updrafts with little prospect of producing severe weather other than brief gusts and small hail, despite other favorable parameters. After all, you need all three necessary ingredients: lift, instability, and moisture, to make a storm!
Myth: The cap was just too strong today.
(image courtesy Dennis Mersereau)
Watch yourself on this one too! Got a sharp, strongly-convergent dryline setting up over Oklahoma but blistering hot air and lots of CIN aloft? You bet, the cap was too strong.
That said, given enough low-level forcing, almost any cap can be broken.
In many cases, you might simply be lacking a surface feature that serves as the lift to get the storm going. After all, that’s another one of the three necessary ingredients (moisture, instability, and lift) to make a storm! Can storms fall apart when there’s 5000 CAPE not a CIN in sight? Absolutely!
Myth: I should report my best guess as to what severe weather is happening.
Once again… REPORT WHAT YOU SEE! All severe hazards run into their fair share of reporting mistakes:
Wind: Wind is reported by spotters, on average, as over 33% stronger than it actually is! This published study suggests that because of our human perception’s tendency to overestimate wind, it is better to simply report, specifically, the damage you see; then, the actual wind speed could be estimated by a known damage scale.
Hail: It’s a cherished tradition to report hail as the size of common objects (golfballs, baseballs… and don’t you ever say “marbles”!). But as a result, this study found a significant lack of 1.25” and 1.5” hail being reported, with much bigger hail being far more common! We all know this to be false, so what can you do? Bring a ruler or caliper, or find a handy hail chart online, and be specific; the NWS and other severe weather researchers will thank you!
Tornadoes: An endlessly-rehashed fault in storm spotters is their tendency to report tornadoes as “large” and “violent.” Be objective, not subjective. “Violent” (EF4/EF5) tornadoes make up a mere ~2% of all tornadoes. Deadly tornadoes are also exceedingly rare. Low cloud bases can give the illusion of very wide tornadoes; furthermore, in some environments, even wide “wedges” are relatively weak, and skinny tubes relatively strong. You can give an estimate on width… but most importantly, where are you, where the tornado is, what time you saw it it, and what visible damage is there, if any.
And, as always, not everything you see is a funnel 😉
Cameron Nixon
Latest posts by Cameron Nixon (see all)
- Sounding and case archive of famous tornadoes and selected severe weather events - March 22, 2021
- Busting severe storm myths before they bust your forecast - April 21, 2020
Excellent article! The examples & graphics were really helpful & the level of explanation was perfect for the target audience. I am looking forward to the remaining instalments! 🖒🖒☺
This article was very helpful! I really love the work from this website and I have a few followup questions after reading:
1) When it comes to perimeters would you recommend using EHI (energy helicity index) when looking for areas that have a higher risk for tornadoes that could go “violent or significant”?
2) What are your thoughts on the newly more available HRRRV4 model and which of the convection allowing models would you recommend for severe weather (more so classic severe weather as many people believe that NAM NEST is best for derecho or similar events) or severe weather outbreaks?
3) Two tools I often see being used but don’t fully understand are the “Potential Hazard” and “SARS Soundings” which are included within the model forecast/environment soundings. If you could explain how to interpret these or how they work or post about reading model forecast soundings all together that would be awesome.
Thank you for your time and effort!!
Alexander, here are my thoughts on this:
1) For now, the only parameter designed to predict violent tornadoes is the “Violent Tornado Parameter” on SPC’s Mesoanalysis. However, as this area is near and dear to me, I’m well aware of the many instances this may not be an ideal predictor, and there is currently no parameter to predict longer-lived tornadoes. I hope to change this 😉
2) No matter what situation, your forecast will always improve over time by using all of them. Statistics!
3) That sounds like a fantastic idea for a future page. I will keep that at the top of my list.
What an excellent article Cameron. Thanks for putting it together. I look forward to your future articles. Cheers!
Great post, very informative with stuff I was never aware of (especially the veer-back-veer and using STP with relation to boundaries. Awesome!
Amazing post! Looking forward to more additions coming up. Very informative!
thanks a lot man. articles like this help me out a lot!